Lexmark 2010 Annual Report Download - page 100
Download and view the complete annual report
Please find page 100 of the 2010 Lexmark annual report below. You can navigate through the pages in the report by either clicking on the pages listed below, or by using the keyword search tool below to find specific information within the annual report.-
 1
1 -
2
-
3
-
4
-
5
-
6
-
7
-
8
-
9
-
10
-
11
-
12
-
13
-
14
-
15
-
16
-
17
-
18
-
19
-
20
-
21
-
22
-
23
-
24
-
25
-
26
-
27
-
28
-
29
-
30
-
31
-
32
-
33
-
34
-
35
-
36
-
37
-
38
-
39
-
40
-
41
-
42
-
43
-
44
-
45
-
46
-
47
-
48
-
49
-
50
-
51
-
52
-
53
-
54
-
55
-
56
-
57
-
58
-
59
-
60
-
61
-
62
-
63
-
64
-
65
-
66
-
67
-
68
-
69
-
70
-
71
-
72
-
73
-
74
-
75
-
76
-
77
-
78
-
79
-
80
-
81
-
82
-
83
-
84
-
85
-
86
-
87
-
88
-
89
-
 90
90 -
 91
91 -
 92
92 -
 93
93 -
 94
94 -
 95
95 -
 96
96 -
 97
97 -
 98
98 -
 99
99 -
 100
100 -
 101
101 -
 102
102 -
 103
103 -
 104
104 -
 105
105 -
 106
106 -
 107
107 -
 108
108 -
 109
109 -
 110
110 -
111
-
112
-
113
-
114
-
115
-
116
-
117
-
118
-
119
-
120
-
121
-
122
-
123
-
124
-
125
-
126
-
127
-
128
-
129
-
130
-
131
-
132
-
133
-
134
-
135
-
136
-
137
-
138
-
139
-
140
-
141
-
142
-
143
-
144
-
145
-
146
-
147
 |
 |

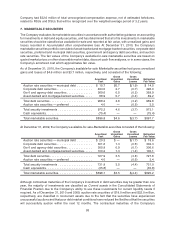
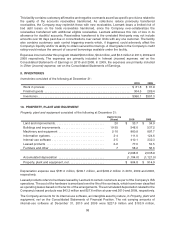
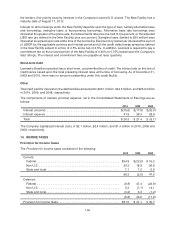
available-for-sale marketable securities noted above are shown below. Expected maturities may differ
from contractual maturities for certain securities that allow for call or prepayment provisions.
Amortized
Cost
Estimated
Fair Value
Amortized
Cost
Estimated
Fair Value
2010 2009
Due in less than one year . . . . . . . . . . . . . . . . . . . . . $279.9 $280.2 $278.9 $279.4
Due in 1-5 years . . . . . . . . . . . . . . . . . . . . . . . . . . . . 645.5 647.5 382.6 383.6
Due after 5 years . . . . . . . . . . . . . . . . . . . . . . . . . . . 46.8 45.4 70.4 68.0
Total available-for-sale marketable securities . . . . . . . $972.2 $973.1 $731.9 $731.0
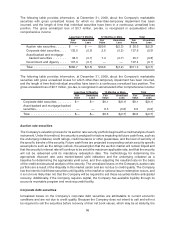
For the twelve months ended December 31, 2010, proceeds from the sales and maturities of the
Company’s available-for-sale marketable securities were $957.5 million and $174.8 million,
respectively. For the twelve months ended December 31, 2009, proceeds from the sales and
maturities of the Company’s available-for-sale marketable securities were $215.0 million and
$679.7 million, respectively. The Company uses the specific identification method when accounting for
the costs of its available-for-sale marketable securities sold.
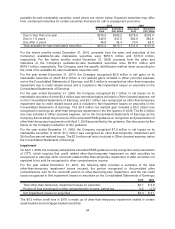
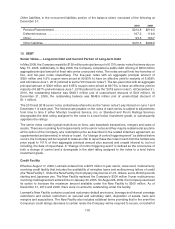
For the year ended December 31, 2010, the Company recognized $2.9 million in net gains on its
marketable securities of which $3.2 million is net realized gains included in Other (income) expense,
net on the Consolidated Statements of Earnings, and $0.3 million is recognized as other-than-temporary
impairment due to credit related losses and is included in Net impairment losses on securities on the
Consolidated Statements of Earnings.
For the year ended December 31, 2009, the Company recognized $2.7 million in net losses on its
marketable securities of which $0.4 million was net realized gains included in Other (income) expense, net
on the Consolidated Statements of Earnings, and $3.1 million was recognized as other-than-temporary
impairment due to credit related losses and is included in Net impairment losses on securities on the
Consolidated Statements of Earnings. The $0.4 million net realized gain included a $0.2 million loss
recognized in earnings as other-than-temporary impairment in the first quarter of 2009. The $0.2 million
loss was included in Other (income) expense, net on the Consolidated Statements of Earnings as the
Company did not adopt the provisions of the amended FASB guidance on recognition and presentation of
other-than-temporary impairments until April 1, 2009 as permitted by the guidance. See discussion further
below on the Company’s adoption of this guidance.
For the year ended December 31, 2008, the Company recognized $7.9 million in net losses on its
marketable securities of which $7.3 million was recognized as other-than-temporary impairment and
$0.6 million was net realized losses. The $7.9 million net loss is included in Other (income) expense, net on
the Consolidated Statements of Earnings.
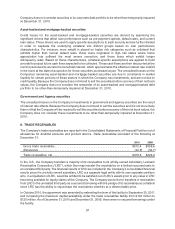
Impairment
On April 1, 2009, the Company adopted the amended FASB guidance on the recognition and presentation
of OTTI, which requires that credit related other-than-temporary impairment on debt securities be
recognized in earnings while noncredit related other-than-temporary impairment of debt securities not
expected to be sold be recognized in other comprehensive income.
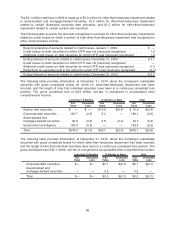
For the year ended December 31, 2010, the following table provides a summary of the total
other-than-temporary impairment losses incurred, the portion recognized in Accumulated other
comprehensive loss for the noncredit portion of other-than-temporary impairment, and the net credit
losses recognized in Net impairment losses on securities on the Consolidated Statements of Earnings:
2010 2009
Total other-than-temporary impairment losses on securities . . . . . . . . . . . . . . . . . . . . $0.1 $ 4.6
Portion of loss recognized in other comprehensive income, before tax . . . . . . . . . . . . 0.2 (1.5)
Net impairment losses on securities . . . . . . . . . . . . . . . . . . . . . . . . . . . . . . . . . . . . . . $0.3 $ 3.1
The $0.3 million credit loss in 2010 is made up of other-than-temporary impairment related to certain
asset-backed and mortgage-backed securities.
94