Lexmark 2010 Annual Report Download - page 50
Download and view the complete annual report
Please find page 50 of the 2010 Lexmark annual report below. You can navigate through the pages in the report by either clicking on the pages listed below, or by using the keyword search tool below to find specific information within the annual report.-
 1
1 -
2
-
3
-
4
-
5
-
6
-
7
-
8
-
9
-
10
-
11
-
12
-
13
-
14
-
15
-
16
-
17
-
18
-
19
-
20
-
21
-
22
-
23
-
24
-
25
-
26
-
27
-
28
-
29
-
30
-
31
-
32
-
33
-
34
-
35
-
36
-
37
-
38
-
39
-
 40
40 -
 41
41 -
 42
42 -
 43
43 -
 44
44 -
 45
45 -
 46
46 -
 47
47 -
 48
48 -
 49
49 -
 50
50 -
 51
51 -
 52
52 -
 53
53 -
 54
54 -
 55
55 -
 56
56 -
 57
57 -
 58
58 -
 59
59 -
 60
60 -
61
-
62
-
63
-
64
-
65
-
66
-
67
-
68
-
69
-
70
-
71
-
72
-
73
-
74
-
75
-
76
-
77
-
78
-
79
-
80
-
81
-
82
-
83
-
84
-
85
-
86
-
87
-
88
-
89
-
90
-
91
-
92
-
93
-
94
-
95
-
96
-
97
-
98
-
99
-
100
-
101
-
102
-
103
-
104
-
105
-
106
-
107
-
108
-
109
-
110
-
111
-
112
-
113
-
114
-
115
-
116
-
117
-
118
-
119
-
120
-
121
-
122
-
123
-
124
-
125
-
126
-
127
-
128
-
129
-
130
-
131
-
132
-
133
-
134
-
135
-
136
-
137
-
138
-
139
-
140
-
141
-
142
-
143
-
144
-
145
-
146
-
147
 |
 |

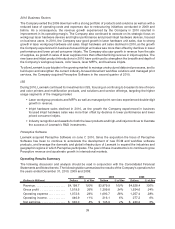
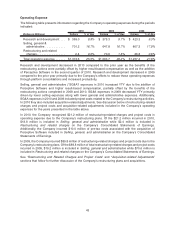
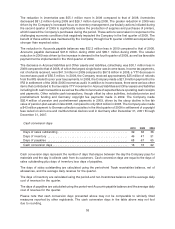
Operating Income (Loss)
The following table provides operating income by reportable segment:
(Dollars in Millions) 2010 2009 Change 2009 2008 Change
ISS . . . . . . . . . . . . . . . . . . . . . . . . . $ 744.6 $ 487.3 53% $ 487.3 $ 622.3 (22)%
% of revenue ................ 17.9% 12.6% 5.3pts 12.6% 13.7% (1.1)pts
Perceptive Software. . . . . . . . . . . . . (16.1) 0.0 0.0 —
% of revenue ................ (43.2)% — — —
All other. . . . . . . . . . . . . . . . . . . . . . (281.6) (271.2) (4)% (271.2) (345.1) 21%
Total operating income (loss) . . . . . . $ 446.9 $ 216.1 107% $ 216.1 $ 277.2 (22)%
% of total revenue ............ 10.6% 5.6% 5pts 5.6% 6.1% (0.5)pts
For the year ended December 31, 2010, the increase in consolidated operating income was primarily due
to an increased gross profit, together with a reduction of operating expenses in ISS.
For the year ended December 31, 2009, the decrease in consolidated operating income was primarily due
to a decreased gross profit partially offset by lower operating expenses in ISS.
During 2010, the Company incurred total pre-tax restructuring-related charges and project costs of
$29.4 million in ISS and $9.2 million in All other as well as pre-tax acquisition-related items of
$25.0 million in Perceptive Software and $7.1 million in All other. During 2009, the Company incurred
total pre-tax restructuring-related charges and project costs of $109 million in ISS and $32.3 million in All
other. During 2008, the Company incurred total pre-tax restructuring-related charges and project costs of
$51.7 million in ISS and $41.0 million in All other. See “Restructuring and Related Charges and Project
Costs” and “Acquisition-related Adjustments” sections that follow for further discussion.
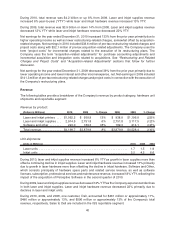
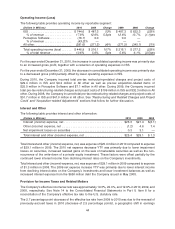
Interest and Other
The following table provides interest and other information:
(Dollars in Millions) 2010 2009 2008
Interest (income) expense, net . . . . . . . . . . . . . . . . . . . . . . . . . . . . . . . . . . $26.3 $21.4 $(6.1)
Other (income) expense, net . . . . . . . . . . . . . . . . . . . . . . . . . . . . . . . . . . . (1.2) 4.6 7.4
Net impairment losses on securities . . . . . . . . . . . . . . . . . . . . . . . . . . . . . . 0.3 3.1 —
Total interest and other (income) expense, net . . . . . . . . . . . . . . . . . . . . . . $25.4 $29.1 $ 1.3
Total interest and other (income) expense, net, was expense of $25.4 million in 2010 compared to expense
of $29.1 million in 2009. The 2010 net expense decrease YTY was primarily due to lower impairment
losses on securities, increased realized gains on the sale of marketable securities as well as the non-
recurrence of the write-down of a private equity investment. These factors were offset partially by the
continued lower interest income from declining interest rates on the Company’s investments.
Total interest and other (income) expense, net, was expense of $29.1 million in 2009 compared to expense
of $1.3 million in 2008. The 2009 net expense increase YTY was primarily due to lower interest income
from declining interest rates on the Company’s investments and lower investment balances as well as
increased interest expense from the $650 million debt the Company issued in May 2008.
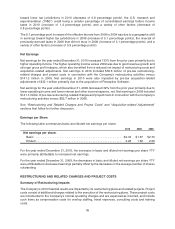
Provision for Income Taxes and Related Matters
The Company’s effective income tax rate was approximately 19.3%, 22.0%, and 12.9% in 2010, 2009, and
2008, respectively. See Note 14 to the Consolidated Financial Statements in Part II, Item 8 for a
reconciliation of the Company’s effective tax rate to the U.S. statutory rate.
The 2.7 percentage point decrease of the effective tax rate from 2009 to 2010 was due to the reversal of
previously-accrued taxes in 2010 (decrease of 2.5 percentage points), a geographic shift in earnings
44