Lexmark 2010 Annual Report Download - page 51
Download and view the complete annual report
Please find page 51 of the 2010 Lexmark annual report below. You can navigate through the pages in the report by either clicking on the pages listed below, or by using the keyword search tool below to find specific information within the annual report.-
 1
1 -
2
-
3
-
4
-
5
-
6
-
7
-
8
-
9
-
10
-
11
-
12
-
13
-
14
-
15
-
16
-
17
-
18
-
19
-
20
-
21
-
22
-
23
-
24
-
25
-
26
-
27
-
28
-
29
-
30
-
31
-
32
-
33
-
34
-
35
-
36
-
37
-
38
-
39
-
40
-
 41
41 -
 42
42 -
 43
43 -
 44
44 -
 45
45 -
 46
46 -
 47
47 -
 48
48 -
 49
49 -
 50
50 -
 51
51 -
 52
52 -
 53
53 -
 54
54 -
 55
55 -
 56
56 -
 57
57 -
 58
58 -
 59
59 -
 60
60 -
 61
61 -
62
-
63
-
64
-
65
-
66
-
67
-
68
-
69
-
70
-
71
-
72
-
73
-
74
-
75
-
76
-
77
-
78
-
79
-
80
-
81
-
82
-
83
-
84
-
85
-
86
-
87
-
88
-
89
-
90
-
91
-
92
-
93
-
94
-
95
-
96
-
97
-
98
-
99
-
100
-
101
-
102
-
103
-
104
-
105
-
106
-
107
-
108
-
109
-
110
-
111
-
112
-
113
-
114
-
115
-
116
-
117
-
118
-
119
-
120
-
121
-
122
-
123
-
124
-
125
-
126
-
127
-
128
-
129
-
130
-
131
-
132
-
133
-
134
-
135
-
136
-
137
-
138
-
139
-
140
-
141
-
142
-
143
-
144
-
145
-
146
-
147
 |
 |

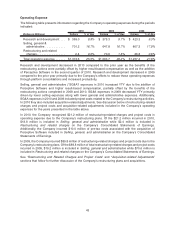
toward lower tax jurisdictions in 2010 (decrease of 0.8 percentage points), the U.S. research and
experimentation (“R&E”) credit being a smaller percentage of consolidated earnings before income
taxes in 2010 (increase of 1.4 percentage points), and a variety of other factors (decrease of
0.8 percentage points).
The 9.1 percentage point increase of the effective tax rate from 2008 to 2009 was due to a geographic shift
in earnings toward higher tax jurisdictions in 2009 (increase of 5.1 percentage points), the reversal of
previously-accrued taxes in 2008 that did not recur in 2009 (increase of 3.1 percentage points), and a
variety of other factors (increase of 0.9 percentage points).
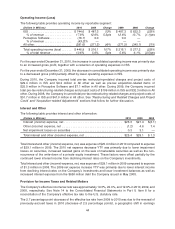
Net Earnings
Net earnings for the year ended December 31, 2010 increased 133% from the prior year primarily due to
higher operating income. The higher operating income versus 2009 was due to good revenue growth and
stronger gross profit margins, which also benefited from a reduced net impact of restructuring costs and
acquisition-related adjustments. Net earnings in 2010 included $38.6 million of pre-tax restructuring-
related charges and project costs in connection with the Company’s restructuring activities versus
$141.3 million in 2009. Net earnings in 2010 were also impacted by pre-tax acquisition-related
adjustments of $32.1 million primarily due to the acquisition of Perceptive Software.
Net earnings for the year ended December 31, 2009 decreased 39% from the prior year primarily due to
lower operating income and lower interest and other income/expense, net. Net earnings in 2009 included
$141.3 million of pre-tax restructuring-related charges and project costs in connection with the Company’s
restructuring activities versus $92.7 million in 2008.
See “Restructuring and Related Charges and Project Costs” and “Acquisition-related Adjustments”
sections that follow for further discussion.
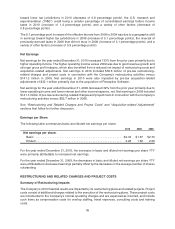
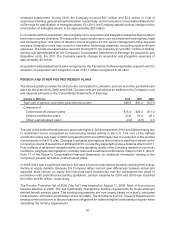
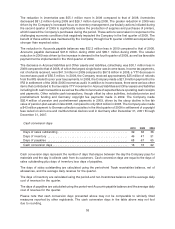
Earnings per Share
The following table summarizes basic and diluted net earnings per share:
2010 2009 2008
Net earnings per share:
Basic . . . . . . . . . . . . . . . . . . . . . . . . . . . . . . . . . . . . . . . . . . . . . . . . . . . $4.33 $1.87 $2.70
Diluted.................................................. 4.28 1.86 2.69
For the year ended December 31, 2010, the increases in basic and diluted net earnings per share YTY
were primarily attributable to increased net earnings.
For the year ended December 31, 2009, the decreases in basic and diluted net earnings per share YTY
were attributable to decreased earnings partially offset by the decreases in the average number of shares
outstanding.
RESTRUCTURING AND RELATED CHARGES AND PROJECT COSTS
Summary of Restructuring Impacts
The Company’s 2010 financial results are impacted by its restructuring plans and related projects. Project
costs consist of additional charges related to the execution of the restructuring plans. These project costs
are incremental to the Company’s normal operating charges and are expensed as incurred, and include
such items as compensation costs for overlap staffing, travel expenses, consulting costs and training
costs.
45