Lexmark 2010 Annual Report Download - page 59
Download and view the complete annual report
Please find page 59 of the 2010 Lexmark annual report below. You can navigate through the pages in the report by either clicking on the pages listed below, or by using the keyword search tool below to find specific information within the annual report.-
 1
1 -
2
-
3
-
4
-
5
-
6
-
7
-
8
-
9
-
10
-
11
-
12
-
13
-
14
-
15
-
16
-
17
-
18
-
19
-
20
-
21
-
22
-
23
-
24
-
25
-
26
-
27
-
28
-
29
-
30
-
31
-
32
-
33
-
34
-
35
-
36
-
37
-
38
-
39
-
40
-
41
-
42
-
43
-
44
-
45
-
46
-
47
-
48
-
 49
49 -
 50
50 -
 51
51 -
 52
52 -
 53
53 -
 54
54 -
 55
55 -
 56
56 -
 57
57 -
 58
58 -
 59
59 -
 60
60 -
 61
61 -
 62
62 -
 63
63 -
 64
64 -
 65
65 -
 66
66 -
 67
67 -
 68
68 -
 69
69 -
70
-
71
-
72
-
73
-
74
-
75
-
76
-
77
-
78
-
79
-
80
-
81
-
82
-
83
-
84
-
85
-
86
-
87
-
88
-
89
-
90
-
91
-
92
-
93
-
94
-
95
-
96
-
97
-
98
-
99
-
100
-
101
-
102
-
103
-
104
-
105
-
106
-
107
-
108
-
109
-
110
-
111
-
112
-
113
-
114
-
115
-
116
-
117
-
118
-
119
-
120
-
121
-
122
-
123
-
124
-
125
-
126
-
127
-
128
-
129
-
130
-
131
-
132
-
133
-
134
-
135
-
136
-
137
-
138
-
139
-
140
-
141
-
142
-
143
-
144
-
145
-
146
-
147
 |
 |

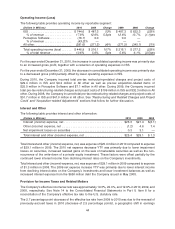
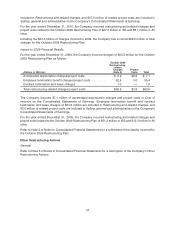
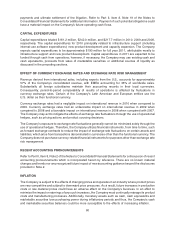
The reduction in Inventories was $55.1 million more in 2009 compared to that of 2008. Inventories
decreased $81.2 million during 2009 and $26.1 million during 2008. The greater reduction in 2009 was
driven by the Company’s increased focus on inventory management, particularly actions initiated during
the second quarter of 2009 to significantly reduce the production of supplies and purchases of printers,
which lowered the Company’s purchases during the period. These actions were taken in response to the
challenging economic conditions that negatively impacted the Company in the first quarter of 2009. The
benefit of these actions was maintained by the Company through fourth quarter of 2009 accompanied by
stronger than expected sales.
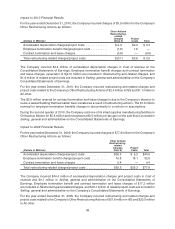
The reduction in Accounts payable balances was $32.3 million less in 2009 compared to that of 2008.
Accounts payable decreased $47.8 million during 2009 and $80.1 million during 2008. The smaller
reduction in 2009 was driven by the increase in demand in the fourth quarter of 2009, as well as favorable
payment terms implemented in the third quarter of 2009.
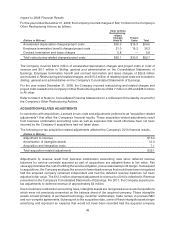
The decrease in Accrued liabilities and Other assets and liabilities, collectively, was $30.1 million less in
2009 compared to that of 2008, of which the largest single factor was income taxes. Income tax payments,
net of refunds received, were $41.3 million in 2009 compared to $97.8 million in 2008, a YTY decrease in
income taxes paid of $56.5 million. In 2009, the Company received approximately $25 million of refunds
from the IRS related to prior year tax payments. In 2008, the Company made a $21.8 million payment to the
IRS in settlement of the 2004-2005 income tax audit. In addition to income taxes, there were various other
items that contributed to the favorable YTY movement in Accrued liabilities and Other assets and liabilities
including both cash transactions as well as the effect of accruals of expected future operating cash receipts
and payments. Other notable cash transactions, though offset by other activities, included pension and
postretirement funding and Germany copyright fee payments made in 2009. The Company made
$92.4 million of pension and postretirement payments in 2009, driven by the steep decline in the fair
value of pension plan assets in late 2008, compared to only $6.6 million in 2008. The Company also made
a $43 million payment to German collection societies in the third quarter of 2009 in settlement of copyright
fees levied on all-in-one and multifunctional devices sold in Germany after December 31, 2001 through
December 31, 2007.
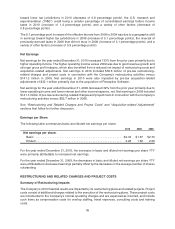
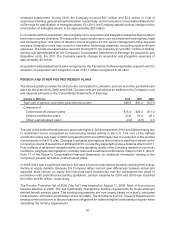
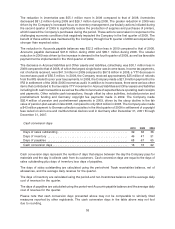
Cash conversion days
2010 2009 2008
Days of sales outstanding . . . . . . . . . . . . . . . . . . . . . . . . . . . . . . . . . . . . . . . . . 39 36 36
Daysofinventory ............................................... 46 47 51
Daysofpayables ............................................... 68 67 65
Cash conversion days . . . . . . . . . . . . . . . . . . . . . . . . . . . . . . . . . . . . . . . . . . . . 18 16 22
Cash conversion days represent the number of days that elapse between the day the Company pays for
materials and the day it collects cash from its customers. Cash conversion days are equal to the days of
sales outstanding plus days of inventory less days of payables.
The days of sales outstanding are calculated using the period-end Trade receivables balance, net of
allowances, and the average daily revenue for the quarter.
The days of inventory are calculated using the period-end net Inventories balance and the average daily
cost of revenue for the quarter.
The days of payables are calculated using the period-end Accounts payable balance and the average daily
cost of revenue for the quarter.
Please note that cash conversion days presented above may not be comparable to similarly titled
measures reported by other registrants. The cash conversion days in the table above may not foot
due to rounding.
53