Lexmark 2010 Annual Report Download - page 48
Download and view the complete annual report
Please find page 48 of the 2010 Lexmark annual report below. You can navigate through the pages in the report by either clicking on the pages listed below, or by using the keyword search tool below to find specific information within the annual report.-
 1
1 -
2
-
3
-
4
-
5
-
6
-
7
-
8
-
9
-
10
-
11
-
12
-
13
-
14
-
15
-
16
-
17
-
18
-
19
-
20
-
21
-
22
-
23
-
24
-
25
-
26
-
27
-
28
-
29
-
30
-
31
-
32
-
33
-
34
-
35
-
36
-
37
-
 38
38 -
 39
39 -
 40
40 -
 41
41 -
 42
42 -
 43
43 -
 44
44 -
 45
45 -
 46
46 -
 47
47 -
 48
48 -
 49
49 -
 50
50 -
 51
51 -
 52
52 -
 53
53 -
 54
54 -
 55
55 -
 56
56 -
 57
57 -
 58
58 -
59
-
60
-
61
-
62
-
63
-
64
-
65
-
66
-
67
-
68
-
69
-
70
-
71
-
72
-
73
-
74
-
75
-
76
-
77
-
78
-
79
-
80
-
81
-
82
-
83
-
84
-
85
-
86
-
87
-
88
-
89
-
90
-
91
-
92
-
93
-
94
-
95
-
96
-
97
-
98
-
99
-
100
-
101
-
102
-
103
-
104
-
105
-
106
-
107
-
108
-
109
-
110
-
111
-
112
-
113
-
114
-
115
-
116
-
117
-
118
-
119
-
120
-
121
-
122
-
123
-
124
-
125
-
126
-
127
-
128
-
129
-
130
-
131
-
132
-
133
-
134
-
135
-
136
-
137
-
138
-
139
-
140
-
141
-
142
-
143
-
144
-
145
-
146
-
147
 |
 |

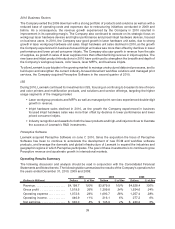
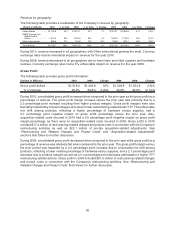
Revenue by geography:
The following table provides a breakdown of the Company’s revenue by geography:
(Dollars in Millions) 2010 % of Total 2009 % of Total % Change 2009 2008 % of Total % Change
United States . . . . . . . . $1,790.9 43% $1,672.1 43% 7% $1,672.1 $1,864.8 41% (10)%
EMEA (Europe, the
Middle East &
Africa) . . . . . . . . . . . 1,510.2 36% 1,453.9 38% 4% 1,453.9 1,742.9 39% (17)%
Other International . . . . 898.6 21% 753.9 19% 19% 753.9 920.7 20% (18)%
Total revenue . . . . . . . . $4,199.7 100% $3,879.9 100% 8% $3,879.9 $4,528.4 100% (14)%
During 2010, revenue increased in all geographies, with Other international growing the most. Currency
exchange rates had an immaterial impact on revenue for the year 2010.
During 2009, revenue decreased in all geographies due to lower laser and inkjet supplies and hardware
revenue. Currency exchange rates had a 3% unfavorable impact on revenue for the year 2009.
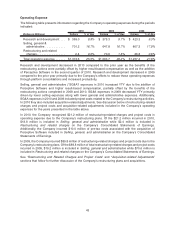
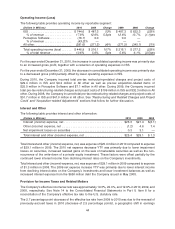
Gross Profit
The following table provides gross profit information:
(Dollars in Millions) 2010 2009 Change 2009 2008 Change
Gross profit dollars . . . . . . . . . . . . $1,519.5 $1,309.8 16% $1,309.8 $1,534.6 (15)%
% of revenue .............. 36.2% 33.8% 2.4pts 33.8% 33.9% (0.1)pts
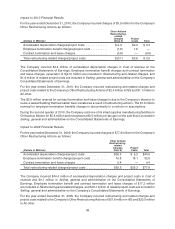
During 2010, consolidated gross profit increased when compared to the prior year as did gross profit as a
percentage of revenue. The gross profit margin increase versus the prior year was primarily due to a
2.5 percentage point increase resulting from higher product margins. Gross profit margins were also
favorably impacted by 0.9 percentage points due to lower restructuring-related costs YTY. The unfavorable
mix shift among products, reflecting a higher percentage of hardware versus supplies, had a
0.7 percentage point negative impact on gross profit percentage versus the prior year. Also,
acquisition-related costs incurred in 2010 had a 0.5 percentage point negative impact on gross profit
margin percentage, as there were no acquisition-related costs incurred in 2009. Gross profit in 2010
included $17.4 million of restructuring-related charges and project costs in connection with the Company’s
restructuring activities as well as $22.1 million of pre-tax acquisition-related adjustments. See
“Restructuring and Related Charges and Project Costs” and “Acquisition-related Adjustments”
sections that follow for further discussion.
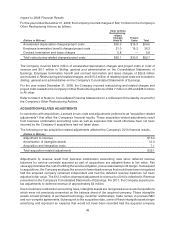
During 2009, consolidated gross profit decreased when compared to the prior year while gross profit as a
percentage of revenue was relatively flat when compared to the prior year. The gross profit margin versus
the prior period was impacted by a 2.4 percentage point increase due to a favorable mix shift among
products, reflecting a lower relative percentage of hardware versus supplies, and a 2.1 percentage point
decrease due to product margins as well as a 0.4 percentage point decrease attributable to higher YTY
restructuring-related actions. Gross profit in 2009 included $51.5 million of restructuring-related charges
and project costs in connection with the Company’s restructuring activities. See “Restructuring and
Related Charges and Project Costs” that follows for further discussion.
42