Lexmark 2010 Annual Report Download - page 69
Download and view the complete annual report
Please find page 69 of the 2010 Lexmark annual report below. You can navigate through the pages in the report by either clicking on the pages listed below, or by using the keyword search tool below to find specific information within the annual report.-
 1
1 -
2
-
3
-
4
-
5
-
6
-
7
-
8
-
9
-
10
-
11
-
12
-
13
-
14
-
15
-
16
-
17
-
18
-
19
-
20
-
21
-
22
-
23
-
24
-
25
-
26
-
27
-
28
-
29
-
30
-
31
-
32
-
33
-
34
-
35
-
36
-
37
-
38
-
39
-
40
-
41
-
42
-
43
-
44
-
45
-
46
-
47
-
48
-
49
-
50
-
51
-
52
-
53
-
54
-
55
-
56
-
57
-
58
-
 59
59 -
 60
60 -
 61
61 -
 62
62 -
 63
63 -
 64
64 -
 65
65 -
 66
66 -
 67
67 -
 68
68 -
 69
69 -
 70
70 -
 71
71 -
 72
72 -
 73
73 -
 74
74 -
 75
75 -
 76
76 -
 77
77 -
 78
78 -
 79
79 -
80
-
81
-
82
-
83
-
84
-
85
-
86
-
87
-
88
-
89
-
90
-
91
-
92
-
93
-
94
-
95
-
96
-
97
-
98
-
99
-
100
-
101
-
102
-
103
-
104
-
105
-
106
-
107
-
108
-
109
-
110
-
111
-
112
-
113
-
114
-
115
-
116
-
117
-
118
-
119
-
120
-
121
-
122
-
123
-
124
-
125
-
126
-
127
-
128
-
129
-
130
-
131
-
132
-
133
-
134
-
135
-
136
-
137
-
138
-
139
-
140
-
141
-
142
-
143
-
144
-
145
-
146
-
147
 |
 |

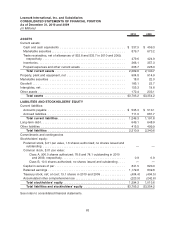
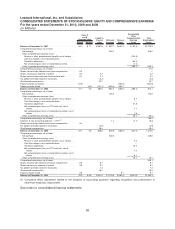
Lexmark International, Inc. and Subsidiaries
CONSOLIDATED STATEMENTS OF FINANCIAL POSITION
As of December 31, 2010 and 2009
(In Millions)
2010 2009
ASSETS
Current assets:
Cash and cash equivalents . . . . . . . . . . . . . . . . . . . . . . . . . . . . . . . . . . . . . . $ 337.5 $ 459.3
Marketable securities . . . . . . . . . . . . . . . . . . . . . . . . . . . . . . . . . . . . . . . . . . . 879.7 673.2
Trade receivables, net of allowances of $32.8 and $33.7 in 2010 and 2009,
respectively . . . . . . . . . . . . . . . . . . . . . . . . . . . . . . . . . . . . . . . . . . . . . . . . 479.6 424.9
Inventories . . . . . . . . . . . . . . . . . . . . . . . . . . . . . . . . . . . . . . . . . . . . . . . . . . . 366.1 357.3
Prepaid expenses and other current assets . . . . . . . . . . . . . . . . . . . . . . . . . . 206.7 226.0
Total current assets . . . . . . . . . . . . . . . . . . . . . . . . . . . . . . . . . . . . . . . . . 2,269.6 2,140.7
Property, plant and equipment, net . . . . . . . . . . . . . . . . . . . . . . . . . . . . . . . . . . 904.8 914.9
Marketable securities . . . . . . . . . . . . . . . . . . . . . . . . . . . . . . . . . . . . . . . . . . . . 18.0 22.0
Goodwill . . . . . . . . . . . . . . . . . . . . . . . . . . . . . . . . . . . . . . . . . . . . . . . . . . . . . . 185.1 23.7
Intangibles, net . . . . . . . . . . . . . . . . . . . . . . . . . . . . . . . . . . . . . . . . . . . . . . . . . 155.3 19.8
Other assets . . . . . . . . . . . . . . . . . . . . . . . . . . . . . . . . . . . . . . . . . . . . . . . . . . . 172.4 233.1
Total assets . . . . . . . . . . . . . . . . . . . . . . . . . . . . . . . . . . . . . . . . . . . . . . . $3,705.2 $3,354.2
LIABILITIES AND STOCKHOLDERS’ EQUITY
Current liabilities:
Accounts payable . . . . . . . . . . . . . . . . . . . . . . . . . . . . . . . . . . . . . . . . . . . . . $ 535.3 $ 510.1
Accrued liabilities . . . . . . . . . . . . . . . . . . . . . . . . . . . . . . . . . . . . . . . . . . . . . . 711.0 681.7
Total current liabilities . . . . . . . . . . . . . . . . . . . . . . . . . . . . . . . . . . . . . . . 1,246.3 1,191.8
Long-term debt . . . . . . . . . . . . . . . . . . . . . . . . . . . . . . . . . . . . . . . . . . . . . . . . . 649.1 648.9
Other liabilities . . . . . . . . . . . . . . . . . . . . . . . . . . . . . . . . . . . . . . . . . . . . . . . . . 415.5 499.9
Total liabilities . . . . . . . . . . . . . . . . . . . . . . . . . . . . . . . . . . . . . . . . . . . . . 2,310.9 2,340.6
Commitments and contingencies
Stockholders’ equity:
Preferred stock, $.01 par value, 1.6 shares authorized; no shares issued and
outstanding . . . . . . . . . . . . . . . . . . . . . . . . . . . . . . . . . . . . . . . . . . . . . . . . — —
Common stock, $.01 par value:
Class A, 900.0 shares authorized; 78.6 and 78.1 outstanding in 2010
and 2009, respectively. . . . . . . . . . . . . . . . . . . . . . . . . . . . . . . . . . . . . 0.9 0.9
Class B, 10.0 shares authorized; no shares issued and outstanding . . . . — —
Capital in excess of par . . . . . . . . . . . . . . . . . . . . . . . . . . . . . . . . . . . . . . . . . 841.5 820.0
Retained earnings . . . . . . . . . . . . . . . . . . . . . . . . . . . . . . . . . . . . . . . . . . . . . 1,179.8 839.8
Treasury stock, net; at cost; 15.1 shares in 2010 and 2009 . . . . . . . . . . . . . . (404.4) (404.5)
Accumulated other comprehensive loss . . . . . . . . . . . . . . . . . . . . . . . . . . . . . (223.5) (242.6)
Total stockholders’ equity . . . . . . . . . . . . . . . . . . . . . . . . . . . . . . . . . . . . 1,394.3 1,013.6
Total liabilities and stockholders’ equity . . . . . . . . . . . . . . . . . . . . . . . . $3,705.2 $3,354.2
See notes to consolidated financial statements.
63