Lexmark 2010 Annual Report Download - page 130
Download and view the complete annual report
Please find page 130 of the 2010 Lexmark annual report below. You can navigate through the pages in the report by either clicking on the pages listed below, or by using the keyword search tool below to find specific information within the annual report.-
 1
1 -
2
-
3
-
4
-
5
-
6
-
7
-
8
-
9
-
10
-
11
-
12
-
13
-
14
-
15
-
16
-
17
-
18
-
19
-
20
-
21
-
22
-
23
-
24
-
25
-
26
-
27
-
28
-
29
-
30
-
31
-
32
-
33
-
34
-
35
-
36
-
37
-
38
-
39
-
40
-
41
-
42
-
43
-
44
-
45
-
46
-
47
-
48
-
49
-
50
-
51
-
52
-
53
-
54
-
55
-
56
-
57
-
58
-
59
-
60
-
61
-
62
-
63
-
64
-
65
-
66
-
67
-
68
-
69
-
70
-
71
-
72
-
73
-
74
-
75
-
76
-
77
-
78
-
79
-
80
-
81
-
82
-
83
-
84
-
85
-
86
-
87
-
88
-
89
-
90
-
91
-
92
-
93
-
94
-
95
-
96
-
97
-
98
-
99
-
100
-
101
-
102
-
103
-
104
-
105
-
106
-
107
-
108
-
109
-
110
-
111
-
112
-
113
-
114
-
115
-
116
-
117
-
118
-
119
-
 120
120 -
 121
121 -
 122
122 -
 123
123 -
 124
124 -
 125
125 -
 126
126 -
 127
127 -
 128
128 -
 129
129 -
 130
130 -
 131
131 -
 132
132 -
 133
133 -
 134
134 -
 135
135 -
 136
136 -
 137
137 -
 138
138 -
 139
139 -
 140
140 -
141
-
142
-
143
-
144
-
145
-
146
-
147
 |
 |

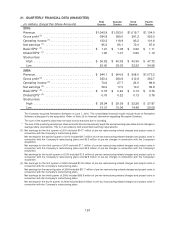
21. QUARTERLY FINANCIAL DATA (UNAUDITED)
(In millions, Except Per Share Amounts) First
Quarter
Second
Quarter
Third
Quarter
Fourth
Quarter
2010:
Revenue . . . . . . . . . . . . . . . . . . . . . . . . . . . . . . . . . . $1,042.9 $1,033.0 $1,019.7 $1,104.0
Gross profit
(1)
. . . . . . . . . . . . . . . . . . . . . . . . . . . . . 384.8 380.0 361.2 393.5
Operating income
(1)
. . . . . . . . . . . . . . . . . . . . . . . . . 133.3 118.9 93.2 101.6
Net earnings
(1)
............................. 95.3 85.1 72.0 87.6
Basic EPS*
(1)
.............................. $ 1.21 $ 1.08 $ 0.92 $ 1.11
Diluted EPS*
(1)
............................ 1.20 1.07 0.90 1.10
Stock prices:
High ................................... $ 36.82 $ 40.08 $ 45.36 $ 47.72
Low.................................... 25.50 33.03 32.22 34.58
2009:
Revenue . . . . . . . . . . . . . . . . . . . . . . . . . . . . . . . . . . $ 944.1 $ 904.6 $ 958.0 $1,073.2
Gross profit
(2)
. . . . . . . . . . . . . . . . . . . . . . . . . . . . . 333.4 280.8 312.9 382.7
Operating income
(2)
......................... 74.6 27.7 24.0 89.8
Net earnings
(2)
............................. 59.2 17.0 10.0 59.8
Basic EPS*
(2)
.............................. $ 0.76 $ 0.22 $ 0.13 $ 0.76
Diluted EPS*
(2)
............................ 0.75 0.22 0.13 0.76
Stock prices:
High ................................... $ 28.94 $ 20.39 $ 22.26 $ 27.87
Low.................................... 15.31 15.06 14.48 20.09
The Company acquired Perceptive Software on June 7, 2010. The consolidated financial results include those of Perceptive
Software subsequent to the acquisition. Refer to Note 20 for financial information regarding Perceptive Software.
The sum of the quarterly data may not equal annual amounts due to rounding.
* The sum of the quarterly earnings per share amounts does not necessarily equal the annual earnings per share due to changes in
average share calculations. This is in accordance with prescribed reporting requirements.
(1) Net earnings for the first quarter of 2010 included $14.7 million of pre-tax restructuring-related charges and project costs in
connection with the Company’s restructuring plans.
Net earnings for the second quarter of 2010 included $8.7 million of pre-tax restructuring-related charges and project costs in
connection with the Company’s restructuring plans and $6.3 million of pre-tax charges in connection with the Company’s
acquisition.
Net earnings for the third quarter of 2010 included $7.7 million of pre-tax restructuring-related charges and project costs in
connection with the Company’s restructuring plans and $5.9 million of pre-tax charges in connection with the Company’s
acquisition.
Net earnings for the fourth quarter of 2010 included $7.6 million of pre-tax restructuring-related charges and project costs in
connection with the Company’s restructuring plans and $6.8 million of pre-tax charges in connection with the Company’s
acquisition.
(2) Net earnings for the first quarter of 2009 included $12.8 million of pre-tax restructuring-related charges and project costs in
connection with the Company’s restructuring plans.
Net earnings for the second quarter of 2009 included $31.7 million of pre-tax restructuring-related charges and project costs in
connection with the Company’s restructuring plans.
Net earnings for the third quarter of 2009 included $50.8 million of pre-tax restructuring-related charges and project costs in
connection with the Company’s restructuring plans.
Net earnings for the fourth quarter of 2009 included $45.9 million of pre-tax restructuring-related charges and project costs in
connection with the Company’s restructuring plans.
124