Lexmark 2010 Annual Report Download - page 85
Download and view the complete annual report
Please find page 85 of the 2010 Lexmark annual report below. You can navigate through the pages in the report by either clicking on the pages listed below, or by using the keyword search tool below to find specific information within the annual report.
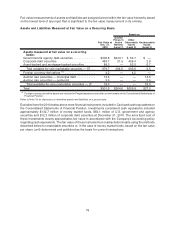
For purposes of comparison, the following information relates to December 31, 2009.
Fair Value at
Dec. 31,
2009
Quoted
Prices in
Active
Markets
(Level 1)
Other
Observable
Inputs
(Level 2)
Unobservable
Inputs
(Level 3)
Based on
Assets measured at fair value on a recurring basis:
Government & agency debt securities . . . . . . . . . . . . . $271.9 $261.6 $ 10.3 $ —
Corporate debt securities . . . . . . . . . . . . . . . . . . . . . . 301.2 — 300.2 1.0
Asset-backed and mortgage-backed securities . . . . . . 100.1 — 97.7 2.4
Total available-for-sale marketable securities — ST . . . 673.2 261.6 408.2 3.4
Foreign currency derivatives
(1)
.................. 0.2 — 0.2 —
Auction rate securities — municipal debt . . . . . . . . . . . 18.6 — — 18.6
Auction rate securities — preferred . . . . . . . . . . . . . . . 3.4 — — 3.4
Total available-for-sale marketable securities — LT . . 22.0 — — 22.0
Total . . . . . . . . . . . . . . . . . . . . . . . . . . . . . . . . . . . . . . $695.4 $261.6 $408.4 $25.4
Liabilities measured at fair value on a recurring basis:
Foreign currency derivatives
(2)
.................. $ 0.3 $ — $ 0.3 $ —
Total ...................................... $ 0.3 $ — $ 0.3 $ —
(1)
Foreign currency derivative assets are included in Prepaid expenses and other current assets on the Consolidated Statements of
Financial Position.
(2)
Foreign currency derivative liabilities are included in Accrued liabilities on the Consolidated Statements of Financial Position.
Refer to Note 18 for disclosure of derivative assets and liabilities on a gross basis.
Excluded from the table above were financial instruments included in Cash and cash equivalents on the
Consolidated Statements of Financial Position. Investments considered cash equivalents included
approximately $301.8 million of money market funds, $34.7 million of agency discount notes and
$1.1 million of corporate debt securities at December 31, 2009. The amortized cost of these
investments closely approximates fair value.
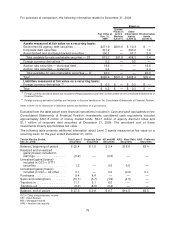
The following table presents additional information about Level 3 assets measured at fair value on a
recurring basis for the year ended December 31, 2010:
Twelve Months Ended,
Dec. 31, 2010
Total Level 3
Securities
Corporate Debt
Securities
AB and MB
Securities
ARS - Muni Debt
Securities
ARS - Preferred
Securities
Balance, beginning of period . . . . $ 25.4 $ 1.0 $ 2.4 $18.6 $3.4
Realized and unrealized
gains/(losses) included in
earnings.................. (0.2) — (0.2) — —
Unrealized gains/(losses)
included in OCI — OTTI
securities . . . . . . . . . . . . . . . . . 1.2 — 0.6 0.6 —
Unrealized gains/(losses)
included in OCI — All other. . . . 0.1 — 0.2 (0.2) 0.1
Purchases . . . . . . . . . . . . . . . . . . 8.4 8.4 — — —
Sales and redemptions . . . . . . . . (10.1) (3.7) (1.9) (4.5) —
Transfers in . . . . . . . . . . . . . . . . . 11.1 5.1 6.0 — —
Transfers out . . . . . . . . . . . . . . . . (8.4) (8.0) (0.4) — —
Balance, end of period . . . . . . . . . $ 27.5 $ 2.8 $ 6.7 $14.5 $3.5
OCI = Other comprehensive income
AB = Asset-backed
MB = Mortgage-backed
ARS = Auction rate security
79


