Lexmark 2010 Annual Report Download - page 97
Download and view the complete annual report
Please find page 97 of the 2010 Lexmark annual report below. You can navigate through the pages in the report by either clicking on the pages listed below, or by using the keyword search tool below to find specific information within the annual report.-
 1
1 -
2
-
3
-
4
-
5
-
6
-
7
-
8
-
9
-
10
-
11
-
12
-
13
-
14
-
15
-
16
-
17
-
18
-
19
-
20
-
21
-
22
-
23
-
24
-
25
-
26
-
27
-
28
-
29
-
30
-
31
-
32
-
33
-
34
-
35
-
36
-
37
-
38
-
39
-
40
-
41
-
42
-
43
-
44
-
45
-
46
-
47
-
48
-
49
-
50
-
51
-
52
-
53
-
54
-
55
-
56
-
57
-
58
-
59
-
60
-
61
-
62
-
63
-
64
-
65
-
66
-
67
-
68
-
69
-
70
-
71
-
72
-
73
-
74
-
75
-
76
-
77
-
78
-
79
-
80
-
81
-
82
-
83
-
84
-
85
-
86
-
 87
87 -
 88
88 -
 89
89 -
 90
90 -
 91
91 -
 92
92 -
 93
93 -
 94
94 -
 95
95 -
 96
96 -
 97
97 -
 98
98 -
 99
99 -
 100
100 -
 101
101 -
 102
102 -
 103
103 -
 104
104 -
 105
105 -
 106
106 -
 107
107 -
108
-
109
-
110
-
111
-
112
-
113
-
114
-
115
-
116
-
117
-
118
-
119
-
120
-
121
-
122
-
123
-
124
-
125
-
126
-
127
-
128
-
129
-
130
-
131
-
132
-
133
-
134
-
135
-
136
-
137
-
138
-
139
-
140
-
141
-
142
-
143
-
144
-
145
-
146
-
147
 |
 |

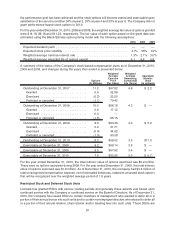
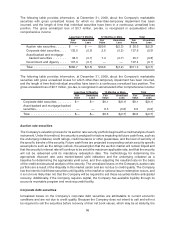
the performance goal has been achieved and the stock options will become vested and exercisable upon
satisfaction of the service condition 34% at year 2, 33% at year 4 and 33% at year 6. The Company did not
grant performance-based stock options in 2010.
For the year ended December 31, 2010, 2009 and 2008, the weighted average fair value of options granted
were $14.18, $6.18 and $11.23, respectively. The fair value of each option award on the grant date was
estimated using the Black-Scholes option-pricing model with the following assumptions:
2010 2009 2008
Expected dividend yield. . . . . . . . . . . . . . . . . . . . . . . . . . . . . . . . . . . . . . . . . . . — — —
Expected stock price volatility . . . . . . . . . . . . . . . . . . . . . . . . . . . . . . . . . . . . . . 41% 35% 33%
Weighted average risk-free interest rate . . . . . . . . . . . . . . . . . . . . . . . . . . . . . . 1.3% 2.1% 3.0%
Weighted average expected life of options (years) . . . . . . . . . . . . . . . . . . . . . . . 5.1 5.6 4.9
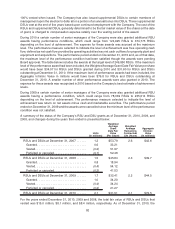
A summary of the status of the Company’s stock-based compensation plans as of December 31, 2010,
2009 and 2008, and changes during the years then ended is presented below:
Options
(In Millions)
Weighted
Average
Exercise
Price
(Per Share)
Weighted
Average
Remaining
Contractual
Life (Years)
Aggregate
Intrinsic
Value
(In millions)
Outstanding at December 31, 2007 . . . . . . . . . . 11.2 $67.82 4.9 $ 2.2
Granted............................. 0.6 32.89
Exercised . . . . . . . . . . . . . . . . . . . . . . . . . . . (0.2) 23.25
Forfeited or canceled . . . . . . . . . . . . . . . . . . . (1.1) 70.42
Outstanding at December 31, 2008 . . . . . . . . . . 10.5 $66.16 4.3 $ —
Granted............................. 0.6 17.12
Exercised . . . . . . . . . . . . . . . . . . . . . . . . . . . 0.0 —
Forfeited or canceled . . . . . . . . . . . . . . . . . . . (1.5) 65.15
Outstanding at December 31, 2009 . . . . . . . . . . 9.6 $63.46 4.0 $ 5.0
Granted............................. 0.0 37.71
Exercised . . . . . . . . . . . . . . . . . . . . . . . . . . . (0.0) 34.62
Forfeited or canceled . . . . . . . . . . . . . . . . . . . (1.3) 90.58
Outstanding at December 31, 2010 . . . . . . . . . . 8.3 $59.02 3.5 $11.0
Exercisable at December 31, 2008 . . . . . . . . . . 9.2 $68.14 3.8 $ —
Exercisable at December 31, 2009 . . . . . . . . . . 8.5 $67.92 3.4 $ —
Exercisable at December 31, 2010 . . . . . . . . . . 7.5 $62.95 3.0 $ 0.7
For the year ended December 31, 2010, the total intrinsic value of options exercised was $0.2 million.
There were no options exercised during 2009. For the year ended December 31, 2008, the total intrinsic
value of options exercised was $1.8 million. As of December 31, 2010, the Company had $3.4 million of
total unrecognized compensation expense, net of estimated forfeitures, related to unvested stock options
that will be recognized over the weighted average period of 1.8 years.
Restricted Stock and Deferred Stock Units
Lexmark has granted RSUs with various vesting periods and generally these awards vest based upon
continued service with the Company or continued service on the Board of Directors. As of December 31,
2010, the Company has issued DSUs to certain members of management who elected to defer all or a
portion of their annual bonus into such units and to certain nonemployee directors who elected to defer all
or a portion of their annual retainer, chair retainer and/or meeting fees into such units. These DSUs are
91