Lexmark 2010 Annual Report Download - page 84
Download and view the complete annual report
Please find page 84 of the 2010 Lexmark annual report below. You can navigate through the pages in the report by either clicking on the pages listed below, or by using the keyword search tool below to find specific information within the annual report.-
 1
1 -
2
-
3
-
4
-
5
-
6
-
7
-
8
-
9
-
10
-
11
-
12
-
13
-
14
-
15
-
16
-
17
-
18
-
19
-
20
-
21
-
22
-
23
-
24
-
25
-
26
-
27
-
28
-
29
-
30
-
31
-
32
-
33
-
34
-
35
-
36
-
37
-
38
-
39
-
40
-
41
-
42
-
43
-
44
-
45
-
46
-
47
-
48
-
49
-
50
-
51
-
52
-
53
-
54
-
55
-
56
-
57
-
58
-
59
-
60
-
61
-
62
-
63
-
64
-
65
-
66
-
67
-
68
-
69
-
70
-
71
-
72
-
73
-
 74
74 -
 75
75 -
 76
76 -
 77
77 -
 78
78 -
 79
79 -
 80
80 -
 81
81 -
 82
82 -
 83
83 -
 84
84 -
 85
85 -
 86
86 -
 87
87 -
 88
88 -
 89
89 -
 90
90 -
 91
91 -
 92
92 -
 93
93 -
 94
94 -
95
-
96
-
97
-
98
-
99
-
100
-
101
-
102
-
103
-
104
-
105
-
106
-
107
-
108
-
109
-
110
-
111
-
112
-
113
-
114
-
115
-
116
-
117
-
118
-
119
-
120
-
121
-
122
-
123
-
124
-
125
-
126
-
127
-
128
-
129
-
130
-
131
-
132
-
133
-
134
-
135
-
136
-
137
-
138
-
139
-
140
-
141
-
142
-
143
-
144
-
145
-
146
-
147
 |
 |

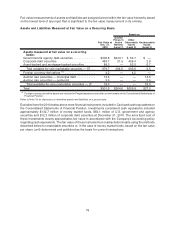
Fair value measurements of assets and liabilities are assigned a level within the fair value hierarchy based
on the lowest level of any input that is significant to the fair value measurement in its entirety.
Assets and Liabilities Measured at Fair Value on a Recurring Basis
Fair Value at
Dec. 31,
2010
Quoted
Prices in
Active
Markets
(Level 1)
Other
Observable
Inputs
(Level 2)
Unobservable
Inputs
(Level 3)
Based on
Assets measured at fair value on a recurring
basis:
Government & agency debt securities . . . . . . . . . . . . . $306.8 $243.1 $ 63.7 $ —
Corporate debt securities . . . . . . . . . . . . . . . . . . . . . . 483.7 21.5 459.4 2.8
Asset-backed and mortgage-backed securities . . . . . . 89.2 — 82.5 6.7
Total available-for-sale marketable securities — ST . . . 879.7 264.6 605.6 9.5
Foreign currency derivatives
(1)
.................. 4.2 — 4.2 —
Auction rate securities — municipal debt . . . . . . . . . . . 14.5 — — 14.5
Auction rate securities — preferred . . . . . . . . . . . . . . . 3.5 — — 3.5
Total available-for-sale marketable securities — LT . . 18.0 — — 18.0
Total . . . . . . . . . . . . . . . . . . . . . . . . . . . . . . . . . . . . . . $901.9 $264.6 $609.8 $27.5
(1)
Foreign currency derivative assets are included in Prepaid expenses and other current assets on the Consolidated Statements of
Financial Position.
Refer to Note 18 for disclosure of derivative assets and liabilities on a gross basis.
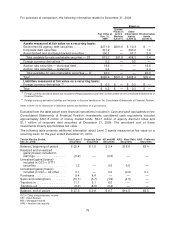
Excluded from the 2010 tables above were financial instruments included in Cash and cash equivalents on
the Consolidated Statements of Financial Position. Investments considered cash equivalents included
approximately $132.7 million of money market funds, $63.1 million of U.S. government and agency
securities and $12.3 million of corporate debt securities at December 31, 2010. The amortized cost of
these investments closely approximates fair value in accordance with the Company’s accounting policy
regarding cash equivalents. The fair value of these instruments is readily determinable using the methods
described below for marketable securities or, in the case of money market funds, based on the fair value
per share (unit) determined and published as the basis for current transactions.
78