Lexmark 2010 Annual Report Download - page 88
Download and view the complete annual report
Please find page 88 of the 2010 Lexmark annual report below. You can navigate through the pages in the report by either clicking on the pages listed below, or by using the keyword search tool below to find specific information within the annual report.Corporate debt securities
The corporate debt securities in which the Company is invested most often have multiple sources of pricing
with relatively low dispersion and are valued using the consensus price method. The fair values of these
securities are most often classified as Level 2. Certain of these securities, however, are classified as
Level 3 because the Company was unable to corroborate the consensus price of these securities with a
sufficient level of observable market data due to a low number of observed trades or pricing sources. In
addition, certain corporate debt securities are classified as Level 1 due to trading volumes sufficient to
indicate an active market for the securities.
Smaller amounts of commercial paper and certificates of deposit, which generally have shorter maturities
and less frequent trades, are also grouped into this fixed income sector. Such securities are valued via
mathematical calculations using observable inputs until such time that market activity reflects an updated
price. The fair values of these securities are typically classified as Level 2 measurements.
Asset-backed and mortgage-backed securities
Securities in this group include asset-backed securities, U.S. agency mortgage-backed securities, and
other mortgage-backed securities. These securities generally have lower levels of trading activity than
government and agency debt securities and corporate debt securities and, therefore, their fair values may
be based on other inputs, such as spread data. The consensus price method is generally used to
determine the most appropriate price in the range provided. Fair value measurements of these
investments are most often categorized as Level 2; however, these securities are categorized as
Level 3 when there is higher variability in the pricing data, a low number of pricing sources, or the
Company is otherwise unable to gather supporting information to conclude that the price can be transacted
upon in the market at the reporting date.
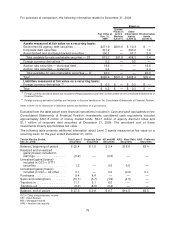
During 2009, the Company valued a small number of asset-backed and mortgage-backed securities using
a discounted cash flow approach rather than the consensus price method described above. During 2010,
the consensus price was corroborated within a reasonable range of fair value and, therefore, the fair values
were not adjusted by the Company. The impact of this change was immaterial.
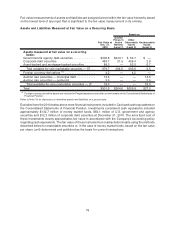
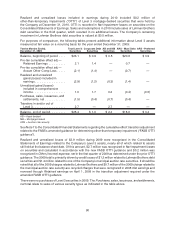
Auction rate securities
The Company’s auction rate securities for which recent auctions were unsuccessful are made up of
student loan revenue bonds valued at $9.0 million, municipal sewer and airport revenue bonds valued at
$5.5 million, and auction rate preferred stock valued at $3.5 million at December 31, 2010. The Company’s
auction rate securities for which recent auctions were unsuccessful were made up of student loan revenue
bonds valued at $13.7 million, municipal sewer and airport revenue bonds valued at $4.9 million, and
auction rate preferred stock valued at $3.4 million at December 31, 2009.
At December 31, 2010, the Company’s auction rate securities for which recent auctions were unsuccessful
were valued using a discounted cash flow model based on the characteristics of the individual securities,
which the Company believes yields the best estimate of fair value. The first step in the valuation included a
credit analysis of the security which considered various factors including the credit quality of the issuer
(and insurer if applicable), the instrument’s position within the capital structure of the issuing authority, and
the composition of the authority’s assets including the effect of insurance and/or government guarantees.
Next, the future cash flows of the instruments were projected based on certain assumptions regarding the
auction rate market significant to the valuation including (1) the auction rate market will remain illiquid and
auctions will continue to fail causing the interest rate to be the maximum applicable rate and (2) the
securities will not be redeemed. These assumptions resulted in discounted cash flow analysis being
performed through the legal maturities of most of the securities, ranging from July 2032 through January
2040, or in the case of the auction rate preferred stock, through the mandatory redemption date of
December 2021. The projected cash flows were then discounted using the applicable yield curve plus a
250 basis point liquidity premium added to the applicable discount rate. Different assumptions were used
for one of the Company’s municipal bonds due to the distressed financial conditions of both the issuer and
82


