Lexmark 2010 Annual Report Download - page 128
Download and view the complete annual report
Please find page 128 of the 2010 Lexmark annual report below. You can navigate through the pages in the report by either clicking on the pages listed below, or by using the keyword search tool below to find specific information within the annual report.-
 1
1 -
2
-
3
-
4
-
5
-
6
-
7
-
8
-
9
-
10
-
11
-
12
-
13
-
14
-
15
-
16
-
17
-
18
-
19
-
20
-
21
-
22
-
23
-
24
-
25
-
26
-
27
-
28
-
29
-
30
-
31
-
32
-
33
-
34
-
35
-
36
-
37
-
38
-
39
-
40
-
41
-
42
-
43
-
44
-
45
-
46
-
47
-
48
-
49
-
50
-
51
-
52
-
53
-
54
-
55
-
56
-
57
-
58
-
59
-
60
-
61
-
62
-
63
-
64
-
65
-
66
-
67
-
68
-
69
-
70
-
71
-
72
-
73
-
74
-
75
-
76
-
77
-
78
-
79
-
80
-
81
-
82
-
83
-
84
-
85
-
86
-
87
-
88
-
89
-
90
-
91
-
92
-
93
-
94
-
95
-
96
-
97
-
98
-
99
-
100
-
101
-
102
-
103
-
104
-
105
-
106
-
107
-
108
-
109
-
110
-
111
-
112
-
113
-
114
-
115
-
116
-
117
-
 118
118 -
 119
119 -
 120
120 -
 121
121 -
 122
122 -
 123
123 -
 124
124 -
 125
125 -
 126
126 -
 127
127 -
 128
128 -
 129
129 -
 130
130 -
 131
131 -
 132
132 -
 133
133 -
 134
134 -
 135
135 -
 136
136 -
 137
137 -
 138
138 -
139
-
140
-
141
-
142
-
143
-
144
-
145
-
146
-
147
 |
 |

distributed printing market. Second, in the fourth quarter of 2010, Lexmark combined its laser and inkjet
printing divisions into a single organization in order to enable the Company to more easily execute its
strategy of targeting and capturing higher usage business segments of the output marketplace and to
further unify its sales, marketing, and research and development of new products and services.
As a result of these actions, the Company is now primarily managed along two segments: Imaging
Solutions and Services (“ISS”) and Perceptive Software. ISS offers a broad portfolio of monochrome and
color laser printers, laser multifunction products and inkjet all-in-one devices as well as a wide range of
services covering its printing products and technology solutions. Perceptive Software offers a complete
suite of ECM software and document workflow solutions.
The Company evaluates the performance of its segments based on revenue and operating income, and
does not include segment assets or nonoperating income/expense items for management reporting
purposes. Segment operating income (loss) includes: selling, general and administrative; research and
development; restructuring and related charges; and other expenses, certain of which are allocated to the
respective segments based on internal measures and may not be indicative of amounts that would be
incurred on a stand alone basis or may not be indicative of results of other enterprises in similar
businesses. All other operating income (loss) includes significant expenses that are managed outside
of the reporting segments. These unallocated costs include such items as information technology
expenses, certain occupancy costs, stock-based compensation and certain other corporate and
regional general and administrative expenses such as finance, legal and human resources.
Acquisition-related costs and integration expenses are also included in All other. Refer to Note 4 for
additional information regarding acquisition-related costs.
Prior year data has been updated to reflect the changes in the Company’s organizational structure,
including the reclassification of certain expenses from All other (previously unallocated) to ISS related to
the consolidation of its laser and inkjet printing organizations discussed above.
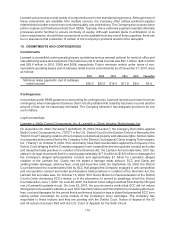
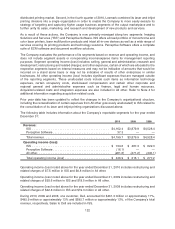
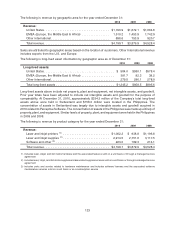
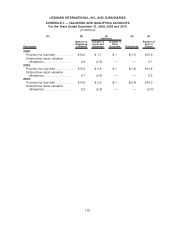
The following table includes information about the Company’s reportable segments for the year ended
December 31:
2010 2009 2008
Revenue:
ISS . . . . . . . . . . . . . . . . . . . . . . . . . . . . . . . . . . . . . . . . . . . . . $4,162.4 $3,879.9 $4,528.4
Perceptive Software . . . . . . . . . . . . . . . . . . . . . . . . . . . . . . . . . 37.3 — —
Total revenue . . . . . . . . . . . . . . . . . . . . . . . . . . . . . . . . . . . . . . $4,199.7 $3,879.9 $4,528.4
Operating income (loss):
ISS . . . . . . . . . . . . . . . . . . . . . . . . . . . . . . . . . . . . . . . . . . . . . $ 744.6 $ 487.3 $ 622.3
Perceptive Software . . . . . . . . . . . . . . . . . . . . . . . . . . . . . . . . . (16.1) — —
All other . . . . . . . . . . . . . . . . . . . . . . . . . . . . . . . . . . . . . . . . . . (281.6) (271.2) (345.1)
Total operating income (loss) . . . . . . . . . . . . . . . . . . . . . . . . . . $ 446.9 $ 216.1 $ 277.2
Operating income (loss) noted above for the year ended December 31, 2010 includes restructuring and
related charges of $7.5 million in ISS and $0.8 million in All other.
Operating income (loss) noted above for the year ended December 31, 2009 includes restructuring and
related charges of $93.6 million in ISS and $18.5 million in All other.
Operating income (loss) noted above for the year ended December 31, 2008 includes restructuring and
related charges of $42.8 million in ISS and $19.3 million in All other.
During 2010, 2009 and 2008, one customer, Dell, accounted for $461.3 million or approximately 11%,
$495.9 million or approximately 13% and $595.7 million or approximately 13%, of the Company’s total
revenue, respectively. Sales to Dell are included in ISS.
122