Lexmark 2010 Annual Report Download - page 116
Download and view the complete annual report
Please find page 116 of the 2010 Lexmark annual report below. You can navigate through the pages in the report by either clicking on the pages listed below, or by using the keyword search tool below to find specific information within the annual report.-
 1
1 -
2
-
3
-
4
-
5
-
6
-
7
-
8
-
9
-
10
-
11
-
12
-
13
-
14
-
15
-
16
-
17
-
18
-
19
-
20
-
21
-
22
-
23
-
24
-
25
-
26
-
27
-
28
-
29
-
30
-
31
-
32
-
33
-
34
-
35
-
36
-
37
-
38
-
39
-
40
-
41
-
42
-
43
-
44
-
45
-
46
-
47
-
48
-
49
-
50
-
51
-
52
-
53
-
54
-
55
-
56
-
57
-
58
-
59
-
60
-
61
-
62
-
63
-
64
-
65
-
66
-
67
-
68
-
69
-
70
-
71
-
72
-
73
-
74
-
75
-
76
-
77
-
78
-
79
-
80
-
81
-
82
-
83
-
84
-
85
-
86
-
87
-
88
-
89
-
90
-
91
-
92
-
93
-
94
-
95
-
96
-
97
-
98
-
99
-
100
-
101
-
102
-
103
-
104
-
105
-
 106
106 -
 107
107 -
 108
108 -
 109
109 -
 110
110 -
 111
111 -
 112
112 -
 113
113 -
 114
114 -
 115
115 -
 116
116 -
 117
117 -
 118
118 -
 119
119 -
 120
120 -
 121
121 -
 122
122 -
 123
123 -
 124
124 -
 125
125 -
 126
126 -
127
-
128
-
129
-
130
-
131
-
132
-
133
-
134
-
135
-
136
-
137
-
138
-
139
-
140
-
141
-
142
-
143
-
144
-
145
-
146
-
147
 |
 |

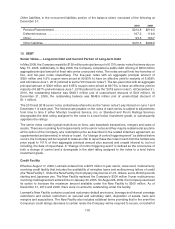
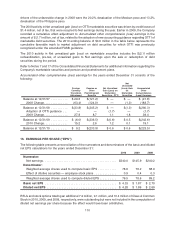
drivers of the unfavorable change in 2008 were the 20.2% devaluation of the Mexican peso and 13.2%
devaluation of the Philippine peso.
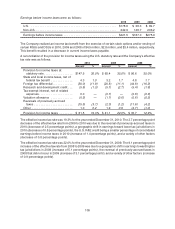
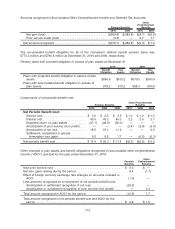
The 2009 activity in Net unrealized gain (loss) on OTTI marketable securities was driven by credit losses of
$1.4 million, net of tax, that were recycled to Net earnings during the year. Earlier in 2009, the Company
recorded a cumulative effect adjustment to Accumulated other comprehensive (loss) earnings in the
amount of $(1.7) million, net of tax, related to the adoption of new accounting guidance regarding OTTI of
marketable debt securities. The 2010 ending balance of $0.6 million in the table below represents the
cumulative favorable mark to market adjustment on debt securities for which OTTI was previously
recognized under the amended FASB guidance.
The 2010 activity in Net unrealized gain (loss) on marketable securities includes the $(2.1) million
reclassification, pre-tax, of unrealized gains to Net earnings upon the sale or redemption of debt
securities during the period.
Refer to Notes 7 and 17 of the Consolidated Financial Statements for additional information regarding the
Company’s marketable securities and pension and postretirement plans.
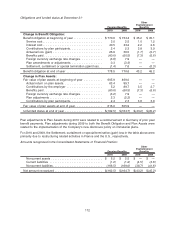
Accumulated other comprehensive (loss) earnings for the years ended December 31 consists of the
following:
Foreign
Currency
Translation
Adjustment
Pension or
Other
Postretirement
Benefits
Net Unrealized
Gain (Loss) on
Marketable
Securities - OTTI
Net
Unrealized
(Loss) Gain
on
Marketable
Securities
Accumulated
Other
Comprehensive
(Loss) Earnings
Balance at 12/31/07 . . . . . . . . . . $ 29.6 $(121.2) $ — $ — $ (91.6)
2008 Change. . . . . . . . . . . . . . (63.4) (124.0) — (1.3) (188.7)
Balance at 12/31/08 . . . . . . . . . . $(33.8) $(245.2) $ — $(1.3) $(280.3)
Adoption of OTTI guidance . . . — — (1.7) — (1.7)
2009 Change. . . . . . . . . . . . . . 27.8 8.7 1.1 1.8 39.4
Balance at 12/31/09 . . . . . . . . . . $ (6.0) $(236.5) $(0.6) $ 0.5 $(242.6)
2010 Change. . . . . . . . . . . . . . 15.2 2.6 1.2 0.1 19.1
Balance at 12/31/10 . . . . . . . . . . $ 9.2 $(233.9) $ 0.6 $ 0.6 $(223.5)
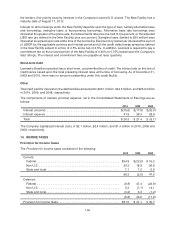
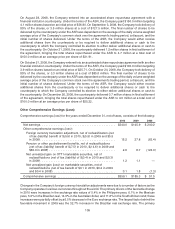
16. EARNINGS PER SHARE (“EPS”)
The following table presents a reconciliation of the numerators and denominators of the basic and diluted
net EPS calculations for the years ended December 31:
2010 2009 2008
Numerator:
Net earnings. . . . . . . . . . . . . . . . . . . . . . . . . . . . . . . . . . . . . . . . . . . $340.0 $145.9 $240.2
Denominator:
Weighted average shares used to compute basic EPS . . . . . . . . . . . 78.6 78.2 88.9
Effect of dilutive securities — employee stock plans . . . . . . . . . . . . . 0.9 0.4 0.3
Weighted average shares used to compute diluted EPS . . . . . . . . . . 79.5 78.6 89.2
Basic net EPS .......................................... $ 4.33 $ 1.87 $ 2.70
Diluted net EPS ......................................... $ 4.28 $ 1.86 $ 2.69
RSUs and stock options totaling an additional 7.2 million, 9.1 million, and 10.4 million of Class A Common
Stock in 2010, 2009, and 2008, respectively, were outstanding but were not included in the computation of
diluted net earnings per share because the effect would have been antidilutive.
110