Lexmark 2010 Annual Report Download - page 60
Download and view the complete annual report
Please find page 60 of the 2010 Lexmark annual report below. You can navigate through the pages in the report by either clicking on the pages listed below, or by using the keyword search tool below to find specific information within the annual report.-
 1
1 -
2
-
3
-
4
-
5
-
6
-
7
-
8
-
9
-
10
-
11
-
12
-
13
-
14
-
15
-
16
-
17
-
18
-
19
-
20
-
21
-
22
-
23
-
24
-
25
-
26
-
27
-
28
-
29
-
30
-
31
-
32
-
33
-
34
-
35
-
36
-
37
-
38
-
39
-
40
-
41
-
42
-
43
-
44
-
45
-
46
-
47
-
48
-
49
-
 50
50 -
 51
51 -
 52
52 -
 53
53 -
 54
54 -
 55
55 -
 56
56 -
 57
57 -
 58
58 -
 59
59 -
 60
60 -
 61
61 -
 62
62 -
 63
63 -
 64
64 -
 65
65 -
 66
66 -
 67
67 -
 68
68 -
 69
69 -
 70
70 -
71
-
72
-
73
-
74
-
75
-
76
-
77
-
78
-
79
-
80
-
81
-
82
-
83
-
84
-
85
-
86
-
87
-
88
-
89
-
90
-
91
-
92
-
93
-
94
-
95
-
96
-
97
-
98
-
99
-
100
-
101
-
102
-
103
-
104
-
105
-
106
-
107
-
108
-
109
-
110
-
111
-
112
-
113
-
114
-
115
-
116
-
117
-
118
-
119
-
120
-
121
-
122
-
123
-
124
-
125
-
126
-
127
-
128
-
129
-
130
-
131
-
132
-
133
-
134
-
135
-
136
-
137
-
138
-
139
-
140
-
141
-
142
-
143
-
144
-
145
-
146
-
147
 |
 |
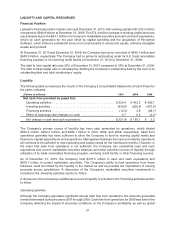
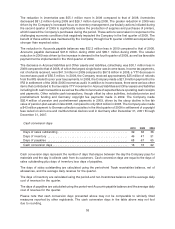
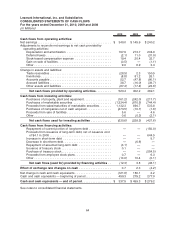
Investing activities
The $402.4 million increase in net cash flows used for investing activities during 2010 compared to that of
2009 was driven by the $263.4 million YTY increase in business acquisitions as well as the $226.3 million
YTY net increase in marketable securities investments. This activity was offset partially by the $80.8 million
YTY decrease in capital spending.
The $199.4 million decrease in net cash flows used for investing activities during 2009 compared to that of
2008 was driven by the $234.8 million YTY net decrease in marketable securities investments offset
partially by $24.3 million YTY increase in capital spending.
The Company’s business acquisitions, marketable securities and capital expenditures are discussed
below.
Business acquisitions
The YTY increase in cash flows used to acquire businesses was driven by the acquisition of Perceptive
Software in the second quarter of 2010 for $280 million cash consideration, or $266.8 million net of cash
acquired. Perceptive Software is an ECM software company and a provider of a broad range of strong
industry solutions. The acquisition enables Lexmark to immediately participate in the adjacent, growing
market segment of ECM software solutions. It also provides additional revenue streams in software
maintenance and professional services that are not paper usage dependent.
In 2009, the Company completed its acquisition of a wholesale company for $10.1 million, net of cash
acquired. The wholesaler was purchased for its current customer base and established presence in
Eastern Europe. Business acquisitions were not material in 2008.
Refer to Part II, Item 8, Note 4 of the Notes to Consolidated Financial Statements for additional information
regarding business combinations.
Marketable securities
The Company increased its marketable securities investments in 2010 by $202.1 million. The Company
decreased its marketable securities investments in 2009 by $24.2 million. The Company increased its
marketable securities investments by $210.6 million in 2008. The Company did not increase its marketable
securities investments in 2009 due to the decrease in cash flows from operations as well as the
conservative investment policies pursued during 2009. Additionally, the Company made certain
payments from available cash during 2009, such as pension contributions and the German copyright
settlement discussed previously, that did not allow the Company to invest these funds in marketable
securities during the year.
The Company’s investments in marketable securities are classified and accounted for as available-for-sale
and reported at fair value. At December 31, 2010 and December 31, 2009, the Company’s marketable
securities portfolio consisted of asset-backed and mortgage-backed securities, corporate debt securities,
preferred and municipal debt securities, U.S. government and agency debt securities, international
government, certificates of deposit and commercial paper. The Company’s auction rate securities,
valued at $18.0 million and $22.0 at December 31, 2010 and December 31, 2009, respectively, were
reported in the noncurrent assets section of the Company’s Consolidated Statements of Financial
Position.
The marketable securities portfolio held by the Company contains market risk (including interest rate risk)
and credit risk. These risks are managed through the Company’s investment policy and investment
management contracts with professional asset managers which require sector diversification, limitations
on maturity and duration, minimum credit quality and other criteria. The Company also maintains adequate
issuer diversification through strict issuer limits except for securities issued by the U.S. government or its
agencies. The Company’s ability to access the portfolio to fund operations could be limited by the liquidity
in the market as well as possible tax implications of moving proceeds across jurisdictions.
54