Lexmark 2010 Annual Report Download - page 98
Download and view the complete annual report
Please find page 98 of the 2010 Lexmark annual report below. You can navigate through the pages in the report by either clicking on the pages listed below, or by using the keyword search tool below to find specific information within the annual report.-
 1
1 -
2
-
3
-
4
-
5
-
6
-
7
-
8
-
9
-
10
-
11
-
12
-
13
-
14
-
15
-
16
-
17
-
18
-
19
-
20
-
21
-
22
-
23
-
24
-
25
-
26
-
27
-
28
-
29
-
30
-
31
-
32
-
33
-
34
-
35
-
36
-
37
-
38
-
39
-
40
-
41
-
42
-
43
-
44
-
45
-
46
-
47
-
48
-
49
-
50
-
51
-
52
-
53
-
54
-
55
-
56
-
57
-
58
-
59
-
60
-
61
-
62
-
63
-
64
-
65
-
66
-
67
-
68
-
69
-
70
-
71
-
72
-
73
-
74
-
75
-
76
-
77
-
78
-
79
-
80
-
81
-
82
-
83
-
84
-
85
-
86
-
87
-
 88
88 -
 89
89 -
 90
90 -
 91
91 -
 92
92 -
 93
93 -
 94
94 -
 95
95 -
 96
96 -
 97
97 -
 98
98 -
 99
99 -
 100
100 -
 101
101 -
 102
102 -
 103
103 -
 104
104 -
 105
105 -
 106
106 -
 107
107 -
 108
108 -
109
-
110
-
111
-
112
-
113
-
114
-
115
-
116
-
117
-
118
-
119
-
120
-
121
-
122
-
123
-
124
-
125
-
126
-
127
-
128
-
129
-
130
-
131
-
132
-
133
-
134
-
135
-
136
-
137
-
138
-
139
-
140
-
141
-
142
-
143
-
144
-
145
-
146
-
147
 |
 |

100% vested when issued. The Company has also issued supplemental DSUs to certain members of
management upon the election to defer all or a portion of an annual bonus into DSUs. These supplemental
DSUs vest at the end of five years based upon continued employment with the Company. The cost of the
RSUs and supplemental DSUs, generally determined to be the fair market value of the shares at the date
of grant, is charged to compensation expense ratably over the vesting period of the award.
During 2010 a certain number of senior managers of the Company were also granted additional RSU
awards having performance conditions, which could range from 124,925 RSUs to 374,775 RSUs
depending on the level of achievement. The expense for these awards was accrued at the maximum
level. The performance measure selected to indicate the level of achievement was free operating cash
flow, defined as net cash flow provided by operating activities less net cash outflows for property plant and
equipment and acquisitions. The performance period ended on December 31, 2010 and, as of that date,
the maximum level of the performance condition had been satisfied though the awards were pending
Board approval. The table below includes the awards at the target level of 249,850 RSUs. If the maximum
level of the performance award had been included, the Weighted Average Grant Date Fair Value per share
would have been $34.07 for RSUs and DSUs granted during 2010 and $31.60 for RSUs and DSUs
outstanding at December 31, 2010. If the maximum level of performance awards had been included, the
Aggregate Intrinsic Value in millions would have been $76.8 for RSUs and DSUs outstanding at
December 31, 2010. A smaller number of other performance awards were also granted in 2010. The
expense for these awards was recognized in 2010 based on the Company’s best estimate of achievement
levels.
During 2009 a certain number of senior managers of the Company were also granted additional RSU
awards having a performance condition, which could range from 78,339 RSUs to 235,014 RSUs
depending on the level of achievement. The performance measure selected to indicate the level of
achievement was return on net assets minus cash and marketable securities. The performance period
ended on December 31, 2009 and the awards were cancelled since the minimum level of the performance
condition was not satisfied.
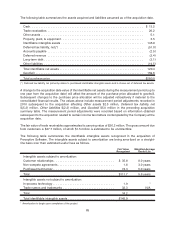
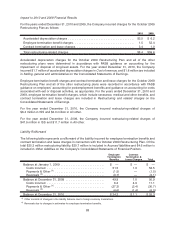
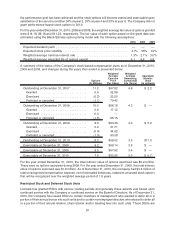
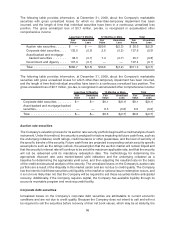
A summary of the status of the Company’s RSU and DSU grants as of December 31, 2010, 2009, and
2008, and changes during the years then ended is presented below:
Units
(In millions)
Weighted
Average
Grant
Date Fair
Value
(Per Share)
Weighted
Average
Remaining
Contractual
Life (Years)
Aggregate
Intrinsic
Value
(In millions)
RSUs and DSUs at December 31, 2007 . . . . . . 1.2 $53.79 2.6 $42.6
Granted............................. 0.6 33.21
Vested.............................. (0.2) 51.97
Forfeited or canceled . . . . . . . . . . . . . . . . . . . (0.1) 52.48
RSUs and DSUs at December 31, 2008 . . . . . . 1.5 $45.84 2.3 $39.7
Granted............................. 0.8 18.94
Vested.............................. (0.4) 54.12
Forfeited or canceled . . . . . . . . . . . . . . . . . . . (0.2) 41.53
RSUs and DSUs at December 31, 2009 . . . . . . 1.7 $32.41 2.2 $44.5
Granted............................. 1.0 34.20
Vested.............................. (0.4) 34.24
Forfeited or canceled . . . . . . . . . . . . . . . . . . . (0.2) 21.27
RSUs and DSUs at December 31, 2010 . . . . . . 2.1 $31.51 2.1 $72.5
For the years ended December 31, 2010, 2009 and 2008, the total fair value of RSUs and DSUs that
vested was $15.0 million, $8.1 million, and $8.4 million, respectively. As of December 31, 2010, the
92