Kraft 2014 Annual Report Download - page 74
Download and view the complete annual report
Please find page 74 of the 2014 Kraft annual report below. You can navigate through the pages in the report by either clicking on the pages listed below, or by using the keyword search tool below to find specific information within the annual report.-
 1
1 -
2
-
3
-
4
-
5
-
6
-
7
-
8
-
9
-
10
-
11
-
12
-
13
-
14
-
15
-
16
-
17
-
18
-
19
-
20
-
21
-
22
-
23
-
24
-
25
-
26
-
27
-
28
-
29
-
30
-
31
-
32
-
33
-
34
-
35
-
36
-
37
-
38
-
39
-
40
-
41
-
42
-
43
-
44
-
45
-
46
-
47
-
48
-
49
-
50
-
51
-
52
-
53
-
54
-
55
-
56
-
57
-
58
-
59
-
60
-
61
-
62
-
63
-
 64
64 -
 65
65 -
 66
66 -
 67
67 -
 68
68 -
 69
69 -
 70
70 -
 71
71 -
 72
72 -
 73
73 -
 74
74 -
 75
75 -
 76
76 -
 77
77 -
 78
78 -
 79
79 -
 80
80 -
 81
81 -
 82
82 -
 83
83 -
 84
84 -
85
-
86
-
87
-
88
-
89
-
90
-
91
-
92
-
93
-
94
-
95
-
96
-
97
-
98
-
99
-
100
-
101
-
102
-
103
-
104
-
105
-
106
-
107
-
108
-
109
-
110
-
111
-
112
-
113
-
114
-
115
-
116
-
117
-
118
-
119
-
120
-
121
-
122
-
123
-
124
-
125
-
126
-
127
-
128
-
129
-
130
-
131
-
132
-
133
-
134
-
135
-
136
-
137
-
138
-
139
-
140
-
141
-
142
-
143
-
144
-
145
-
146
-
147
-
148
-
149
-
150
-
151
-
152
-
153
-
154
-
155
-
156
-
157
-
158
-
159
-
160
-
161
-
162
-
163
-
164
-
165
-
166
-
167
-
168
-
169
-
170
 |
 |
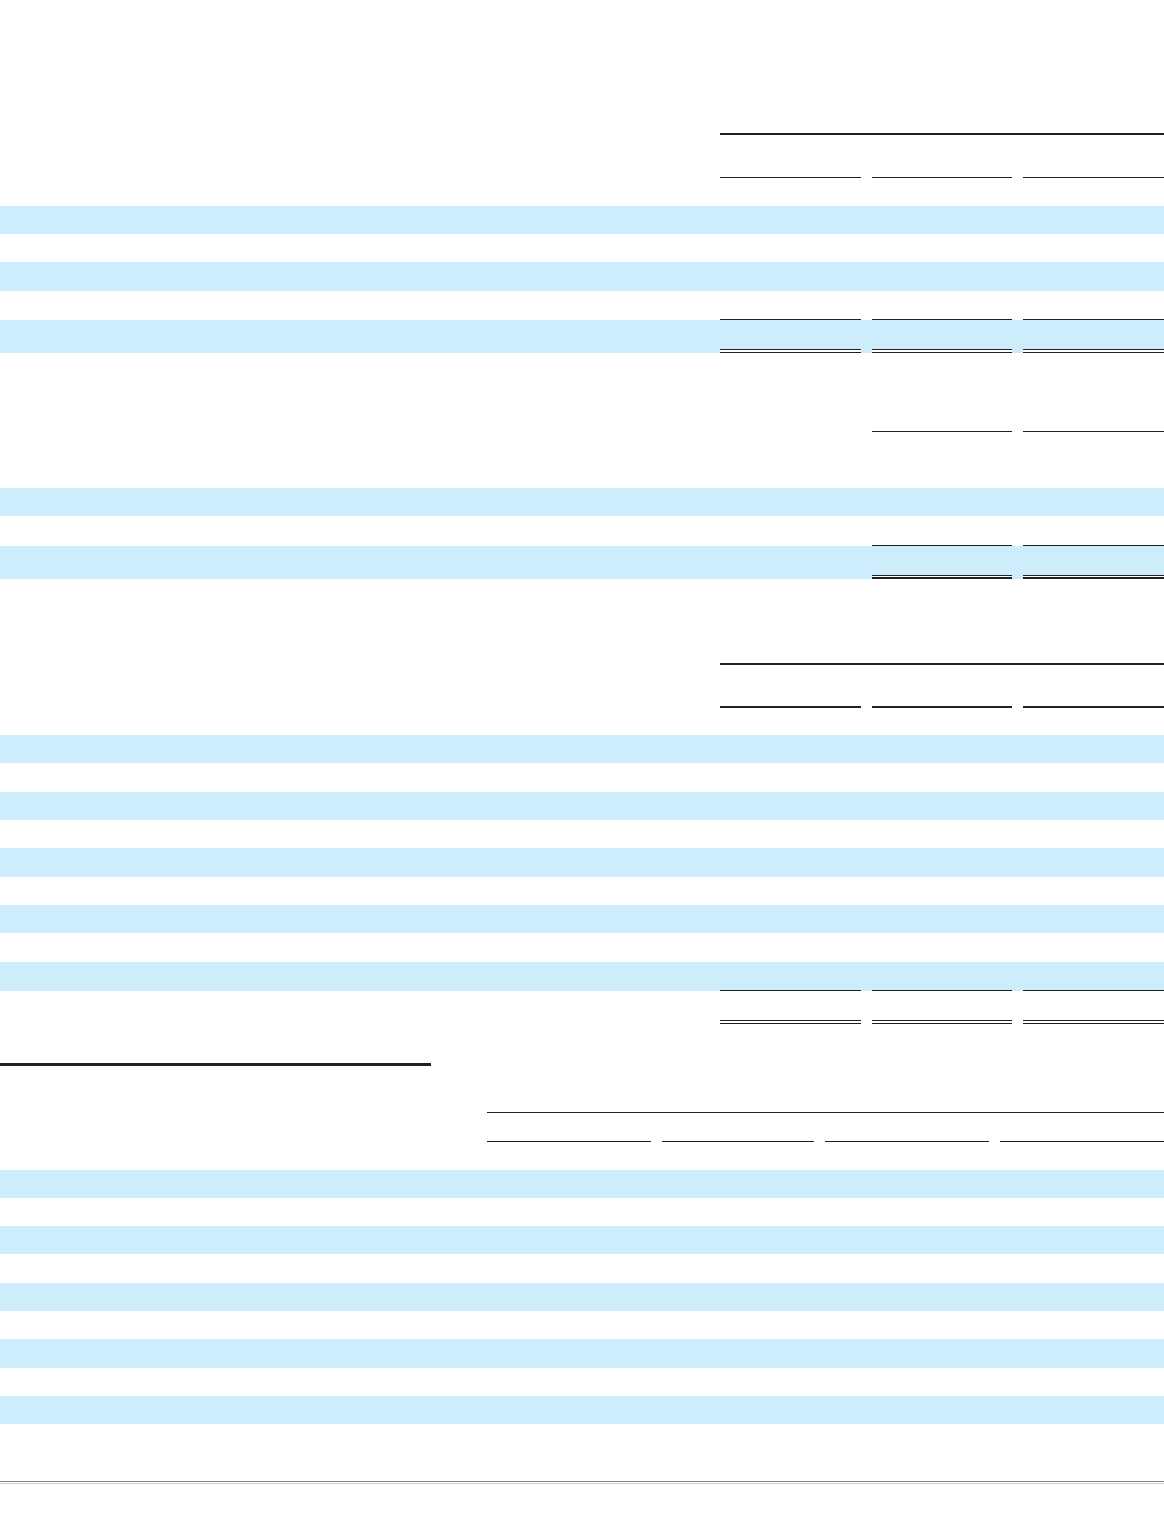
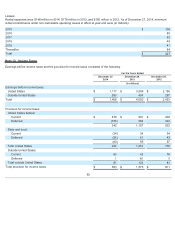
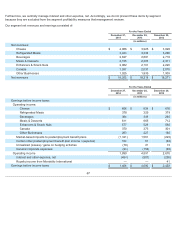
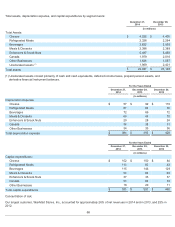
Geographic data for net revenues and long-lived assets were:
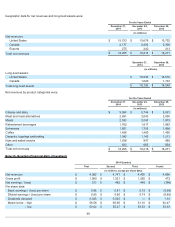
Net revenues by product categories were:
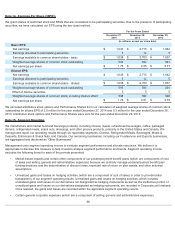
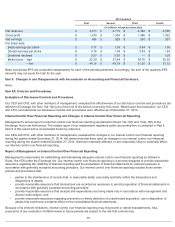
Note 16. Quarterly Financial Data (Unaudited)
69
For the Years Ended
December 27,
2014
December 28,
2013
December 29,
2012
(in millions)
Net revenues:
United States $ 15,753 $ 15,676 $ 15,752
Canada 2,177 2,302 2,306
Exports 275 240 213
Total net revenues $18,205 $18,218 $18,271
December 27,
2014 December 28,
2013
(in millions)
Long-lived assets:
United States $16,536 $16,516
Canada 1,620 1,724
Total long-lived assets $18,156 $18,240
For the Years Ended
December 27,
2014 December 28,
2013 December 29,
2012
(in millions)
Cheese and dairy $5,954 $5,744 $5,591
Meat and meat alternatives 2,691 2,643 2,659
Meals 2,033 2,047 1,973
Refreshment beverages 1,762 1,817 1,863
Enhancers 1,601 1,705 1,868
Coffee 1,456 1,460 1,450
Desserts, toppings and baking 1,042 1,142 1,213
Nuts and salted snacks 1,036 997 986
Other 630 663 668
Total net revenues $ 18,205 $ 18,218 $ 18,271
2014 Quarters
First Second Third Fourth
(in millions, except per share data)
Net revenues $4,362 $4,747 $ 4,400 $4,696
Gross profit $1,560 $ 1,521 $ 1,292 $472
Net earnings / (loss) $513 $482 $ 446 $(398 )
Per share data:
Basic earnings / (loss) per share $0.86 $0.81 $ 0.75 $(0.68 )
Diluted earnings / (loss) per share $0.85 $0.80 $ 0.74 $(0.68 )
Dividends declared $0.525 $0.525 $ — $1.10
Market price – high $ 56.56 $60.60 $ 61.10 $ 64.47
– low $50.54 $55.47 $ 53.33 $53.63