Kraft 2014 Annual Report Download - page 36
Download and view the complete annual report
Please find page 36 of the 2014 Kraft annual report below. You can navigate through the pages in the report by either clicking on the pages listed below, or by using the keyword search tool below to find specific information within the annual report.-
 1
1 -
2
-
3
-
4
-
5
-
6
-
7
-
8
-
9
-
10
-
11
-
12
-
13
-
14
-
15
-
16
-
17
-
18
-
19
-
20
-
21
-
22
-
23
-
24
-
25
-
 26
26 -
 27
27 -
 28
28 -
 29
29 -
 30
30 -
 31
31 -
 32
32 -
 33
33 -
 34
34 -
 35
35 -
 36
36 -
 37
37 -
 38
38 -
 39
39 -
 40
40 -
 41
41 -
 42
42 -
 43
43 -
 44
44 -
 45
45 -
 46
46 -
47
-
48
-
49
-
50
-
51
-
52
-
53
-
54
-
55
-
56
-
57
-
58
-
59
-
60
-
61
-
62
-
63
-
64
-
65
-
66
-
67
-
68
-
69
-
70
-
71
-
72
-
73
-
74
-
75
-
76
-
77
-
78
-
79
-
80
-
81
-
82
-
83
-
84
-
85
-
86
-
87
-
88
-
89
-
90
-
91
-
92
-
93
-
94
-
95
-
96
-
97
-
98
-
99
-
100
-
101
-
102
-
103
-
104
-
105
-
106
-
107
-
108
-
109
-
110
-
111
-
112
-
113
-
114
-
115
-
116
-
117
-
118
-
119
-
120
-
121
-
122
-
123
-
124
-
125
-
126
-
127
-
128
-
129
-
130
-
131
-
132
-
133
-
134
-
135
-
136
-
137
-
138
-
139
-
140
-
141
-
142
-
143
-
144
-
145
-
146
-
147
-
148
-
149
-
150
-
151
-
152
-
153
-
154
-
155
-
156
-
157
-
158
-
159
-
160
-
161
-
162
-
163
-
164
-
165
-
166
-
167
-
168
-
169
-
170
 |
 |

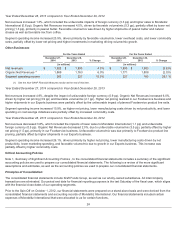
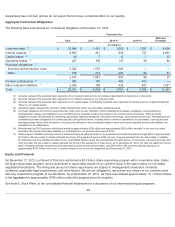
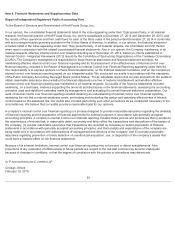
Item 7A. Quantitative and Qualitative Disclosures about Market Risk.
As we operate primarily in North America but source our commodities from global markets and periodically enter into financing or
other arrangements abroad, we use financial instruments to manage our primary market risk exposures, which are commodity
price, foreign currency exchange rate, and interest rate risks. We monitor and manage these exposures as part of our overall risk
management program. Our risk management program focuses on the unpredictability of financial markets and seeks to reduce the
potentially adverse effects that the volatility of these markets may have on our operating results. We maintain commodity price,
foreign currency, and interest rate risk management policies that principally use derivative instruments to reduce significant,
unanticipated earnings fluctuations that may arise from volatility in commodity prices, foreign currency exchange rates, and interest
rates. We also sell commodity futures to unprice future purchase commitments, and we occasionally use related futures to cross-
hedge a commodity exposure. We are not a party to leveraged derivatives and, by policy, do not use financial instruments for
speculative purposes. Refer to Note 1, Summary of Significant Accounting Policies, and Note 10, Financial Instruments , to the
consolidated financial statements for further details of our commodity price, foreign currency, and interest rate risk management
policies and the types of derivative instruments we use to hedge those exposures.
Value at Risk:
We use a value at risk (“VAR”) computation to estimate: (1) the potential one-day loss in pre-tax earnings of our commodity price
and foreign currency-sensitive derivative financial instruments; and (2) the potential one-day loss in the fair value of our interest
rate-sensitive financial instruments. We included our debt, commodity futures, forwards and options, foreign currency forwards, and
interest rate swaps in our VAR computation. Excluded from the computation were anticipated transactions and foreign currency
trade payables and receivables which the financial instruments are intended to hedge.
We made the VAR estimates assuming normal market conditions, using a 95% confidence interval. We used a “variance / co-
variance” model to determine the observed interrelationships between movements in interest rates and various currencies. These
interrelationships were determined by observing interest rate and forward currency
31
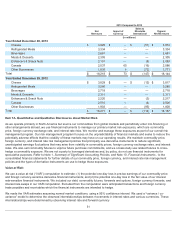
2013 Compared to 2012
Net
Revenues
Impact of
Currency
Sales to
MondelƝz
International
Organic
Net Revenues
(in millions)
Year Ended December 28, 2013
Cheese $3,925 $ — $(51 ) $3,874
Refrigerated Meals 3,334 — — 3,334
Beverages 2,681 — — 2,681
Meals & Desserts 2,305 — — 2,305
Enhancers & Snack Nuts 2,101 — (8 ) 2,093
Canada 2,037
65 (16 ) 2,086
Other Businesses 1,835 8 (72 ) 1,771
Total $ 18,218 $73
$ (147 ) $ 18,144
Year Ended December 29, 2012
Cheese $ 3,829
$—
$(12 ) $ 3,817
Refrigerated Meals 3,280 — — 3,280
Beverages 2,718 — — 2,718
Meals & Desserts 2,311 — — 2,311
Enhancers & Snack Nuts 2,220 — (3 ) 2,217
Canada 2,010 — (4 ) 2,006
Other Businesses 1,903 — (95 ) 1,808
Total $18,271 $ — $(114 ) $18,157