Kraft 2014 Annual Report Download - page 71
Download and view the complete annual report
Please find page 71 of the 2014 Kraft annual report below. You can navigate through the pages in the report by either clicking on the pages listed below, or by using the keyword search tool below to find specific information within the annual report.-
 1
1 -
2
-
3
-
4
-
5
-
6
-
7
-
8
-
9
-
10
-
11
-
12
-
13
-
14
-
15
-
16
-
17
-
18
-
19
-
20
-
21
-
22
-
23
-
24
-
25
-
26
-
27
-
28
-
29
-
30
-
31
-
32
-
33
-
34
-
35
-
36
-
37
-
38
-
39
-
40
-
41
-
42
-
43
-
44
-
45
-
46
-
47
-
48
-
49
-
50
-
51
-
52
-
53
-
54
-
55
-
56
-
57
-
58
-
59
-
60
-
 61
61 -
 62
62 -
 63
63 -
 64
64 -
 65
65 -
 66
66 -
 67
67 -
 68
68 -
 69
69 -
 70
70 -
 71
71 -
 72
72 -
 73
73 -
 74
74 -
 75
75 -
 76
76 -
 77
77 -
 78
78 -
 79
79 -
 80
80 -
 81
81 -
82
-
83
-
84
-
85
-
86
-
87
-
88
-
89
-
90
-
91
-
92
-
93
-
94
-
95
-
96
-
97
-
98
-
99
-
100
-
101
-
102
-
103
-
104
-
105
-
106
-
107
-
108
-
109
-
110
-
111
-
112
-
113
-
114
-
115
-
116
-
117
-
118
-
119
-
120
-
121
-
122
-
123
-
124
-
125
-
126
-
127
-
128
-
129
-
130
-
131
-
132
-
133
-
134
-
135
-
136
-
137
-
138
-
139
-
140
-
141
-
142
-
143
-
144
-
145
-
146
-
147
-
148
-
149
-
150
-
151
-
152
-
153
-
154
-
155
-
156
-
157
-
158
-
159
-
160
-
161
-
162
-
163
-
164
-
165
-
166
-
167
-
168
-
169
-
170
 |
 |

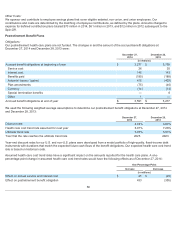
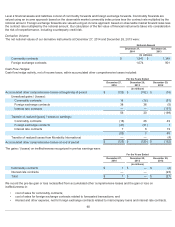
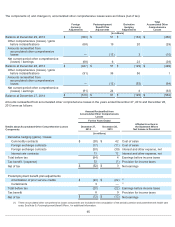
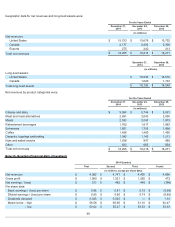
Note 14. Earnings Per Share (“EPS”)
We grant shares of restricted stock and RSUs that are considered to be participating securities. Due to the presence of participating
securities, we have calculated our EPS using the two-class method.
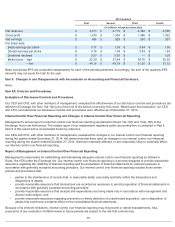
We excluded antidilutive stock options and Performance Shares from our calculation of weighted average shares of common stock
outstanding for diluted EPS of 2.0 million for the year ended December 27, 2014 and 0.3 million for the year ended December 28,
2013. Antidilutive stock options and Performance Shares were zero for the year ended December 29, 2012.
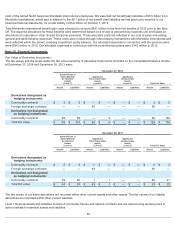
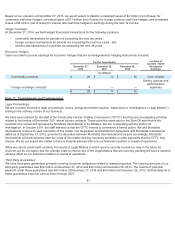
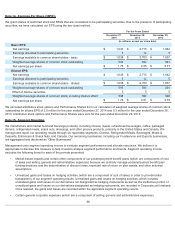
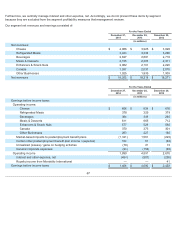
Note 15. Segment Reporting
We manufacture and market food and beverage products, including cheese, meats, refreshment beverages, coffee, packaged
dinners, refrigerated meals, snack nuts, dressings, and other grocery products, primarily in the United States and Canada. We
manage and report our operating results through six reportable segments: Cheese, Refrigerated Meals, Beverages, Meals &
Desserts, Enhancers & Snack Nuts, and Canada. Our remaining businesses, including our Foodservice and Exports businesses,
are aggregated and disclosed as “Other Businesses”.
Management uses segment operating income to evaluate segment performance and allocate resources. We believe it is
appropriate to disclose this measure to help investors analyze segment performance and trends. Segment operating income
excludes the following items for each of the periods presented:
66
For the Years Ended
December 27,
2014 December 28,
2013 December 29,
2012
(in millions, except per share data)
Basic EPS:
Net earnings $ 1,043 $2,715 $1,642
Earnings allocated to participating securities 5 12 5
Earnings available to common shareholders - basic $ 1,038 $2,703
$1,637
Weighted average shares of common stock outstanding 593 594 591
Net earnings per share $ 1.75
$4.55
$2.77
Diluted EPS:
Net earnings $ 1,043 $2,715 $1,642
Earnings allocated to participating securities 5 12 5
Earnings available to common shareholders - diluted $ 1,038 $2,703
$1,637
Weighted average shares of common stock outstanding 593 594 591
Effect of dilutive securities 5 5 5
Weighted average shares of common stock, including dilutive effect 598 599 596
Net earnings per share $ 1.74
$4.51
$2.75
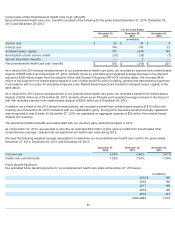
• Market-based impacts and certain other components of our postemployment benefit plans (which are components of cost
of sales and selling, general and administrative expenses) because we centrally manage postemployment benefit plan
funding decisions and the determination of discount rates, expected rate of return on plan assets, and other actuarial
assumptions.
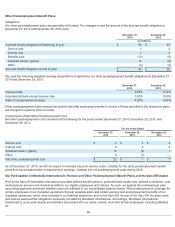
• Unrealized gains and losses on hedging activities (which are a component of cost of sales) in order to provide better
transparency of our segment operating results. Unrealized gains and losses on hedging activities, which includes
unrealized gains and losses on our derivatives not designated as hedging instruments as well as the ineffective portion of
unrealized gains and losses on our derivatives designated as hedging instruments, are recorded in Corporate until realized.
Once realized, the gains and losses are recorded within the applicable segment operating results.
• Certain general corporate expenses (which are a component of selling, general and administrative expenses).