Kraft 2014 Annual Report Download - page 22
Download and view the complete annual report
Please find page 22 of the 2014 Kraft annual report below. You can navigate through the pages in the report by either clicking on the pages listed below, or by using the keyword search tool below to find specific information within the annual report.-
 1
1 -
2
-
3
-
4
-
5
-
6
-
7
-
8
-
9
-
10
-
11
-
 12
12 -
 13
13 -
 14
14 -
 15
15 -
 16
16 -
 17
17 -
 18
18 -
 19
19 -
 20
20 -
 21
21 -
 22
22 -
 23
23 -
 24
24 -
 25
25 -
 26
26 -
 27
27 -
 28
28 -
 29
29 -
 30
30 -
 31
31 -
 32
32 -
33
-
34
-
35
-
36
-
37
-
38
-
39
-
40
-
41
-
42
-
43
-
44
-
45
-
46
-
47
-
48
-
49
-
50
-
51
-
52
-
53
-
54
-
55
-
56
-
57
-
58
-
59
-
60
-
61
-
62
-
63
-
64
-
65
-
66
-
67
-
68
-
69
-
70
-
71
-
72
-
73
-
74
-
75
-
76
-
77
-
78
-
79
-
80
-
81
-
82
-
83
-
84
-
85
-
86
-
87
-
88
-
89
-
90
-
91
-
92
-
93
-
94
-
95
-
96
-
97
-
98
-
99
-
100
-
101
-
102
-
103
-
104
-
105
-
106
-
107
-
108
-
109
-
110
-
111
-
112
-
113
-
114
-
115
-
116
-
117
-
118
-
119
-
120
-
121
-
122
-
123
-
124
-
125
-
126
-
127
-
128
-
129
-
130
-
131
-
132
-
133
-
134
-
135
-
136
-
137
-
138
-
139
-
140
-
141
-
142
-
143
-
144
-
145
-
146
-
147
-
148
-
149
-
150
-
151
-
152
-
153
-
154
-
155
-
156
-
157
-
158
-
159
-
160
-
161
-
162
-
163
-
164
-
165
-
166
-
167
-
168
-
169
-
170
 |
 |

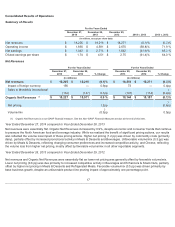
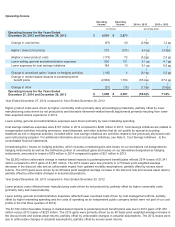
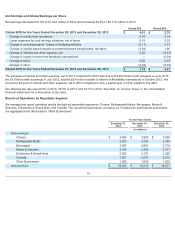
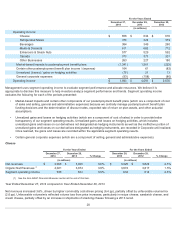
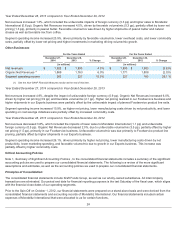
Operating Income
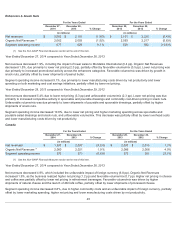
Year Ended December 27, 2014 compared to Year Ended December 28, 2013
Higher product costs were driven by higher commodity costs (primarily dairy and packaging materials), partially offset by lower
manufacturing costs driven by net productivity and favorable retirement-related benefit adjustments primarily resulting from lower-
than-expected claims experience in 2014.
Lower selling, general and administrative expenses were driven primarily by lower marketing spending.
Cost savings initiatives expenses were $107 million in 2014 compared to $290 million in 2013. Cost savings initiatives are related to
reorganization activities including severance, asset disposals, and other activities that do not qualify for special accounting
treatment as exit or disposal activities. Included within cost savings initiatives are activities related to the previously disclosed multi-
year restructuring program. For additional information about cost savings initiatives, see Note 5, Cost Savings Initiatives , to the
consolidated financial statements.
Unrealized gains / losses on hedging activities, which includes unrealized gains and losses on our derivatives not designated as
hedging instruments as well as the ineffective portion of unrealized gains and losses on our derivatives designated as hedging
instruments, amounted to losses of $79 million in 2014 compared to gains of $21 million in 2013.
The $2,902 million unfavorable change in market-based impacts to postemployment benefit plans reflects 2014 losses of $1,341
million compared to 2013 gains of $1,561 million. The 2014 losses were due primarily to a 70 basis point weighted average
decrease in the discount rate and an unfavorable impact from updated mortality assumptions, partially offset by excess asset
returns. The 2013 gains were driven by an 80 basis point weighted average increase in the discount rate and excess asset returns,
partially offset by unfavorable changes in actuarial assumptions.
Year Ended December 28, 2013 compared to Year Ended December 29, 2012
Lower product costs reflected lower manufacturing costs driven by net productivity, partially offset by higher commodity costs
(primarily dairy and meat products).
Lower selling, general and administrative expenses reflected lower overhead costs driven by cost management efforts, partially
offset by higher marketing spending and the costs of operating as an independent public company (which were not part of our cost
profile in the first three quarters of 2012).
The $1,784 million favorable change in market-based impacts to postemployment benefit plans was due to 2013 gains of $1,561
million versus 2012 losses of $223 million. The 2013 gains were primarily driven by an 80 basis point weighted average increase in
the discount rate and excess asset returns, partially offset by unfavorable changes in actuarial assumptions. The 2012 losses were
due to unfavorable changes in actuarial assumptions, partially offset by excess asset returns.
Operating
Income
Operating
Income 2014 v. 2013 2013 v. 2012
(in millions)
(percentage point)
Operating Income for the Years Ended
December 28, 2013 and December 29, 2012 $4,591 $2,670
Change in volume/mix (97 ) 40 (2.9
)
pp 1.2 pp
Higher / (lower) net pricing 219 (109) 6.6 pp (3.4
)
pp
(Higher) / lower product costs (173) 72 (5.2
)
pp 2.3 pp
Lower selling, general and administrative expenses 200 131 6.1 pp 4.1 pp
Lower expenses for cost savings initiatives 183 13 6.1 pp 0.8 pp
Change in unrealized gains / losses on hedging activities (100) 8 (3.1
)
pp 0.2 pp
Change in market-based impacts to postemployment
benefit plans (2,902 ) 1,784 (65.4
)
pp 67.2 pp
Change in other (31 ) (18 ) (1.0
)
pp (0.5
)
pp
Operating Income for the Years Ended
December 27, 2014 and December 28, 2013 $ 1,890 $ 4,591 (58.8 )% 71.9%