Kraft 2014 Annual Report Download - page 35
Download and view the complete annual report
Please find page 35 of the 2014 Kraft annual report below. You can navigate through the pages in the report by either clicking on the pages listed below, or by using the keyword search tool below to find specific information within the annual report.-
 1
1 -
2
-
3
-
4
-
5
-
6
-
7
-
8
-
9
-
10
-
11
-
12
-
13
-
14
-
15
-
16
-
17
-
18
-
19
-
20
-
21
-
22
-
23
-
24
-
 25
25 -
 26
26 -
 27
27 -
 28
28 -
 29
29 -
 30
30 -
 31
31 -
 32
32 -
 33
33 -
 34
34 -
 35
35 -
 36
36 -
 37
37 -
 38
38 -
 39
39 -
 40
40 -
 41
41 -
 42
42 -
 43
43 -
 44
44 -
 45
45 -
46
-
47
-
48
-
49
-
50
-
51
-
52
-
53
-
54
-
55
-
56
-
57
-
58
-
59
-
60
-
61
-
62
-
63
-
64
-
65
-
66
-
67
-
68
-
69
-
70
-
71
-
72
-
73
-
74
-
75
-
76
-
77
-
78
-
79
-
80
-
81
-
82
-
83
-
84
-
85
-
86
-
87
-
88
-
89
-
90
-
91
-
92
-
93
-
94
-
95
-
96
-
97
-
98
-
99
-
100
-
101
-
102
-
103
-
104
-
105
-
106
-
107
-
108
-
109
-
110
-
111
-
112
-
113
-
114
-
115
-
116
-
117
-
118
-
119
-
120
-
121
-
122
-
123
-
124
-
125
-
126
-
127
-
128
-
129
-
130
-
131
-
132
-
133
-
134
-
135
-
136
-
137
-
138
-
139
-
140
-
141
-
142
-
143
-
144
-
145
-
146
-
147
-
148
-
149
-
150
-
151
-
152
-
153
-
154
-
155
-
156
-
157
-
158
-
159
-
160
-
161
-
162
-
163
-
164
-
165
-
166
-
167
-
168
-
169
-
170
 |
 |

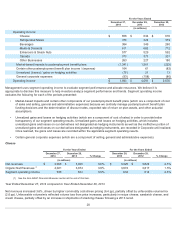
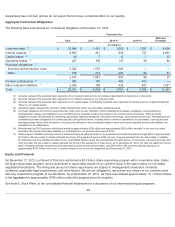
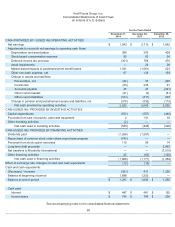
Dividends:
We paid dividends of $1,266 million in 2014 and $1,207 million in 2013. No dividends were paid in 2012. On December 16, 2014,
our Board of Directors declared a cash dividend of $0.55 per share of common stock, which was paid on January 16, 2015 to
shareholders of record on December 26, 2014. In connection with this dividend, we recorded $324 million of dividends payable as
of December 27, 2014. The present annualized dividend rate is $2.20 per share of common stock. The declaration of dividends is
subject to the discretion of our Board of Directors and depends on various factors, including our net earnings, financial condition,
cash requirements, future prospects, and other factors that our Board of Directors deems relevant to its analysis and decision
making.
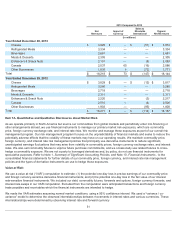
Non-GAAP Financial Measures
To supplement our financial statements presented in accordance with U.S. GAAP, we present Organic Net Revenues, which is
considered a non-GAAP financial measure. We define Organic Net Revenues as net revenues excluding the impact of transactions
with MondelƝz International, acquisitions, divestitures (including the termination of a full line of business due to the loss of a
licensing or distribution arrangement, and the complete exit of business out of a foreign country), currency and the 53
rd
week of
shipments when it occurs. We calculate the impact of currency on net revenues by holding exchange rates constant at the previous
year's exchange rate. We believe that presenting Organic Net Revenues is useful because it (1) provides both management and
investors meaningful supplemental information regarding financial performance by excluding certain items, (2) permits investors to
view our performance using the same tools that management uses to budget, make operating and strategic decisions, and evaluate
our historical performance, and (3) otherwise provides supplemental information that may be useful to investors in evaluating us.
We believe that the presentation of Organic Net Revenues, when considered together with the corresponding U.S. GAAP financial
measure and the reconciliation to that measure, provides investors with additional understanding of the factors and trends affecting
our business than could be obtained absent these disclosures. Non-GAAP financial measures should be viewed in addition to, and
not as an alternative for, our results prepared in accordance with U.S. GAAP. In addition, the non-GAAP measures we use may
differ from non-GAAP measures used by other companies, and other companies may not define the non-GAAP measures we use
in the same way. A reconciliation of Organic Net Revenues to net revenues is set forth below.
30
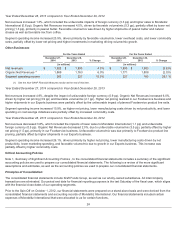
2014 Compared to 2013
Net
Revenues
Impact of
Currency
Sales to
MondelƝz
International
Organic
Net Revenues
(in millions)
Year Ended December 27, 2014
Cheese $4,066 $ — $(45 ) $4,021
Refrigerated Meals 3,433 — — 3,433
Beverages 2,627 — — 2,627
Meals & Desserts 2,155 — — 2,155
Enhancers & Snack Nuts 2,062 — — 2,062
Canada 1,937 139 (16 ) 2,060
Other Businesses 1,925 17 (73 ) 1,869
Total $ 18,205 $ 156 $ (134 ) $ 18,227
Year Ended December 28, 2013
Cheese $ 3,925 $— $(51 ) $ 3,874
Refrigerated Meals 3,334 — — 3,334
Beverages 2,681 — — 2,681
Meals & Desserts 2,305 — — 2,305
Enhancers & Snack Nuts 2,101 — (8 ) 2,093
Canada 2,037 — (16 ) 2,021
Other Businesses 1,835 — (72 ) 1,763
Total $18,218 $ — $(147 ) $18,071