Kraft 2014 Annual Report Download - page 48
Download and view the complete annual report
Please find page 48 of the 2014 Kraft annual report below. You can navigate through the pages in the report by either clicking on the pages listed below, or by using the keyword search tool below to find specific information within the annual report.-
 1
1 -
2
-
3
-
4
-
5
-
6
-
7
-
8
-
9
-
10
-
11
-
12
-
13
-
14
-
15
-
16
-
17
-
18
-
19
-
20
-
21
-
22
-
23
-
24
-
25
-
26
-
27
-
28
-
29
-
30
-
31
-
32
-
33
-
34
-
35
-
36
-
37
-
 38
38 -
 39
39 -
 40
40 -
 41
41 -
 42
42 -
 43
43 -
 44
44 -
 45
45 -
 46
46 -
 47
47 -
 48
48 -
 49
49 -
 50
50 -
 51
51 -
 52
52 -
 53
53 -
 54
54 -
 55
55 -
 56
56 -
 57
57 -
 58
58 -
59
-
60
-
61
-
62
-
63
-
64
-
65
-
66
-
67
-
68
-
69
-
70
-
71
-
72
-
73
-
74
-
75
-
76
-
77
-
78
-
79
-
80
-
81
-
82
-
83
-
84
-
85
-
86
-
87
-
88
-
89
-
90
-
91
-
92
-
93
-
94
-
95
-
96
-
97
-
98
-
99
-
100
-
101
-
102
-
103
-
104
-
105
-
106
-
107
-
108
-
109
-
110
-
111
-
112
-
113
-
114
-
115
-
116
-
117
-
118
-
119
-
120
-
121
-
122
-
123
-
124
-
125
-
126
-
127
-
128
-
129
-
130
-
131
-
132
-
133
-
134
-
135
-
136
-
137
-
138
-
139
-
140
-
141
-
142
-
143
-
144
-
145
-
146
-
147
-
148
-
149
-
150
-
151
-
152
-
153
-
154
-
155
-
156
-
157
-
158
-
159
-
160
-
161
-
162
-
163
-
164
-
165
-
166
-
167
-
168
-
169
-
170
 |
 |

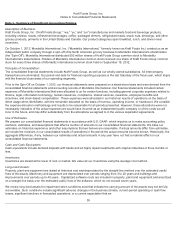
2017. Early adoption is not permitted. We are currently evaluating the impact that this ASU will have on our financial statements
and related disclosures.
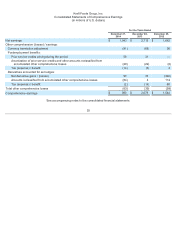
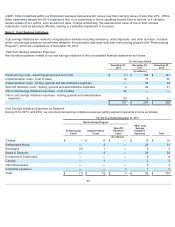
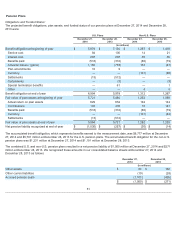
Note 2. Inventories
Inventories at December 27, 2014 and December 28, 2013 were:
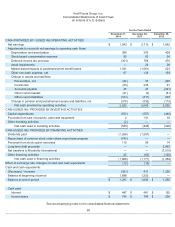
Note 3. Property, Plant and Equipment
Property, plant and equipment at December 27, 2014 and December 28, 2013 were:
In 2013, we sold and leased back two of our headquarters facilities for a loss of approximately $36 million . We received net
proceeds of $101 million in connection with the sales.
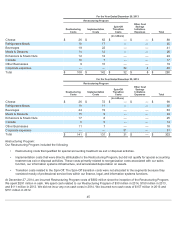
Note 4. Goodwill and Intangible Assets
Goodwill by reportable segment at December 27, 2014 and December 28, 2013 was:
The change in Goodwill during 2014 of $101 million reflects the impact of foreign currency.
Intangible assets consist primarily of indefinite-lived trademarks. Amortizing intangible assets were insignificant in both periods
presented.
We test goodwill and indefinite-lived intangible assets for impairment at least annually in the fourth quarter or when a triggering
event occurs. There were no impairments of goodwill or intangible assets in 2014, 2013, or 2012. During our annual 2014 indefinite-
lived intangible asset impairment test, we noted that a $958 million trademark and
43
December 27,
2014
December 28,
2013
(in millions)
Raw materials $ 481 $453
Work in process 296 294
Finished product 998 869
Inventories $ 1,775
$ 1,616
December 27,
2014
December 28,
2013
(in millions)
Land $ 79 $72
Buildings and improvements 1,881 1,806
Machinery and equipment 5,619 5,584
Construction in progress 464 360
8,043 7,822
Accumulated depreciation (3,851 ) (3,707 )
Property, plant and equipment, net $ 4,192 $4,115
December 27,
2014
December 28,
2013
(in millions)
Cheese $ 3,000 $3,000
Refrigerated Meals 985 985
Beverages 1,290 1,290
Meals & Desserts 1,572 1,572
Enhancers & Snack Nuts 2,644 2,644
Canada 1,051 1,141
Other Businesses 862 873
Goodwill $ 11,404
$ 11,505