Kraft 2014 Annual Report Download - page 73
Download and view the complete annual report
Please find page 73 of the 2014 Kraft annual report below. You can navigate through the pages in the report by either clicking on the pages listed below, or by using the keyword search tool below to find specific information within the annual report.-
 1
1 -
2
-
3
-
4
-
5
-
6
-
7
-
8
-
9
-
10
-
11
-
12
-
13
-
14
-
15
-
16
-
17
-
18
-
19
-
20
-
21
-
22
-
23
-
24
-
25
-
26
-
27
-
28
-
29
-
30
-
31
-
32
-
33
-
34
-
35
-
36
-
37
-
38
-
39
-
40
-
41
-
42
-
43
-
44
-
45
-
46
-
47
-
48
-
49
-
50
-
51
-
52
-
53
-
54
-
55
-
56
-
57
-
58
-
59
-
60
-
61
-
62
-
 63
63 -
 64
64 -
 65
65 -
 66
66 -
 67
67 -
 68
68 -
 69
69 -
 70
70 -
 71
71 -
 72
72 -
 73
73 -
 74
74 -
 75
75 -
 76
76 -
 77
77 -
 78
78 -
 79
79 -
 80
80 -
 81
81 -
 82
82 -
 83
83 -
84
-
85
-
86
-
87
-
88
-
89
-
90
-
91
-
92
-
93
-
94
-
95
-
96
-
97
-
98
-
99
-
100
-
101
-
102
-
103
-
104
-
105
-
106
-
107
-
108
-
109
-
110
-
111
-
112
-
113
-
114
-
115
-
116
-
117
-
118
-
119
-
120
-
121
-
122
-
123
-
124
-
125
-
126
-
127
-
128
-
129
-
130
-
131
-
132
-
133
-
134
-
135
-
136
-
137
-
138
-
139
-
140
-
141
-
142
-
143
-
144
-
145
-
146
-
147
-
148
-
149
-
150
-
151
-
152
-
153
-
154
-
155
-
156
-
157
-
158
-
159
-
160
-
161
-
162
-
163
-
164
-
165
-
166
-
167
-
168
-
169
-
170
 |
 |
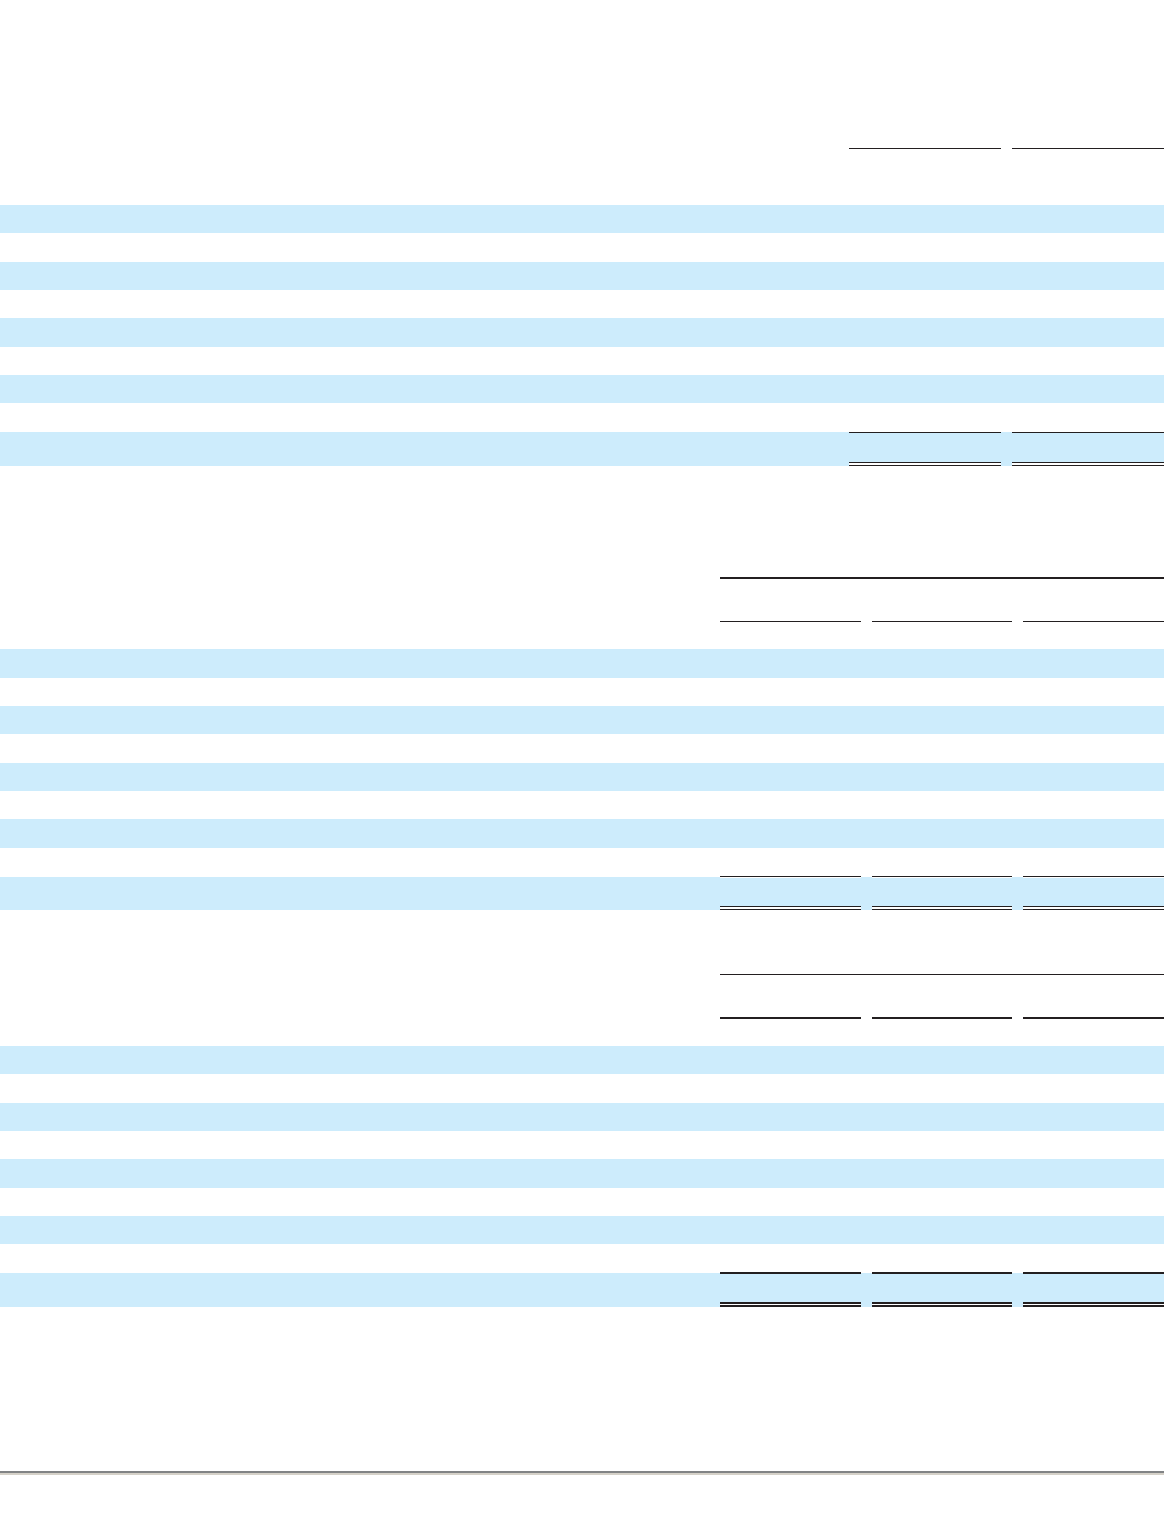
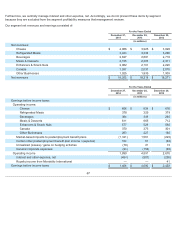
Total assets, depreciation expense, and capital expenditures by segment were:
(1) Unallocated assets consist primarily of cash and cash equivalents, deferred income taxes, prepaid pension assets, and
derivative financial instrument balances.
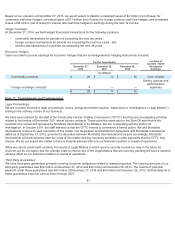
Concentration of risk:
Our largest customer, Wal-Mart Stores, Inc., accounted for approximately 26% of net revenues in 2014 and in 2013, and 25% in
2012.
68
December 27,
2014
December 28,
2013
(in millions)
Total Assets:
Cheese $4,528 $4,400
Refrigerated Meals 2,328 2,294
Beverages 2,632 2,593
Meals & Desserts 2,398 2,389
Enhancers & Snack Nuts 5,487 5,458
Canada 1,979 2,016
Other Businesses 1,626 1,597
Unallocated assets
(1)
1,969 2,401
Total assets $22,947 $23,148
For the Years Ended
December 27,
2014 December 28,
2013 December 29,
2012
(in millions)
Depreciation Expense:
Cheese $ 57 $92 $ 119
Refrigerated Meals 87 84 76
Beverages 72 69 72
Meals & Desserts 69 49 70
Enhancers & Snack Nuts 29 28 24
Canada 36 38 31
Other Businesses 34 33 36
Total depreciation expense $384 $393 $428
For the Years Ended
December 27,
2014 December 28,
2013 December 29,
2012
(in millions)
Capital expenditures:
Cheese $ 152 $ 150 $84
Refrigerated Meals 110 80 83
Beverages 115 146 129
Meals & Desserts 50 68 63
Enhancers & Snack Nuts 37 33 37
Canada 53 60 33
Other Businesses 18 20 11
Total capital expenditures $535 $557 $440