Kraft 2014 Annual Report Download - page 72
Download and view the complete annual report
Please find page 72 of the 2014 Kraft annual report below. You can navigate through the pages in the report by either clicking on the pages listed below, or by using the keyword search tool below to find specific information within the annual report.-
 1
1 -
2
-
3
-
4
-
5
-
6
-
7
-
8
-
9
-
10
-
11
-
12
-
13
-
14
-
15
-
16
-
17
-
18
-
19
-
20
-
21
-
22
-
23
-
24
-
25
-
26
-
27
-
28
-
29
-
30
-
31
-
32
-
33
-
34
-
35
-
36
-
37
-
38
-
39
-
40
-
41
-
42
-
43
-
44
-
45
-
46
-
47
-
48
-
49
-
50
-
51
-
52
-
53
-
54
-
55
-
56
-
57
-
58
-
59
-
60
-
61
-
 62
62 -
 63
63 -
 64
64 -
 65
65 -
 66
66 -
 67
67 -
 68
68 -
 69
69 -
 70
70 -
 71
71 -
 72
72 -
 73
73 -
 74
74 -
 75
75 -
 76
76 -
 77
77 -
 78
78 -
 79
79 -
 80
80 -
 81
81 -
 82
82 -
83
-
84
-
85
-
86
-
87
-
88
-
89
-
90
-
91
-
92
-
93
-
94
-
95
-
96
-
97
-
98
-
99
-
100
-
101
-
102
-
103
-
104
-
105
-
106
-
107
-
108
-
109
-
110
-
111
-
112
-
113
-
114
-
115
-
116
-
117
-
118
-
119
-
120
-
121
-
122
-
123
-
124
-
125
-
126
-
127
-
128
-
129
-
130
-
131
-
132
-
133
-
134
-
135
-
136
-
137
-
138
-
139
-
140
-
141
-
142
-
143
-
144
-
145
-
146
-
147
-
148
-
149
-
150
-
151
-
152
-
153
-
154
-
155
-
156
-
157
-
158
-
159
-
160
-
161
-
162
-
163
-
164
-
165
-
166
-
167
-
168
-
169
-
170
 |
 |

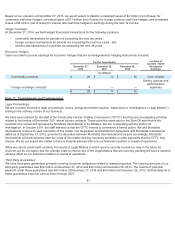
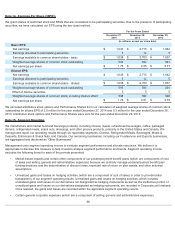
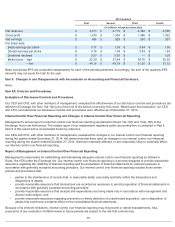
Furthermore, we centrally manage interest and other expense, net. Accordingly, we do not present these items by segment
because they are excluded from the segment profitability measures that management reviews.
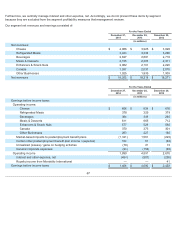
Our segment net revenues and earnings consisted of:
67
For the Years Ended
December 27,
2014 December 28,
2013 December 29,
2012
(in millions)
Net revenues:
Cheese $ 4,066 $ 3,925 $ 3,829
Refrigerated Meals 3,433 3,334 3,280
Beverages 2,627 2,681 2,718
Meals & Desserts 2,155 2,305 2,311
Enhancers & Snack Nuts 2,062 2,101 2,220
Canada 1,937 2,037 2,010
Other Businesses 1,925 1,835 1,903
Net revenues $18,205 $18,218 $18,271
For the Years Ended
December 27,
2014
December 28,
2013
December 29,
2012
(in millions)
Earnings before income taxes:
Operating income:
Cheese $656 $634 $618
Refrigerated Meals 378 329 379
Beverages 384 349 260
Meals & Desserts 611 665 712
Enhancers & Snack Nuts 577 529 592
Canada 370 373 301
Other Businesses 263 227 180
Market-based impacts to postemployment benefit plans (1,341 ) 1,561 (223 )
Certain other postemployment benefit plan income / (expense) 164 61 (82 )
Unrealized (losses) / gains on hedging activities (79 ) 21 13
General corporate expenses (93 ) (158 ) (80 )
Operating income 1,890 4,591 2,670
Interest and other expense, net (484) (501 ) (258 )
Royalty income from MondelƝz International — — 41
Earnings before income taxes $1,406 $4,090 $2,453