Kraft 2014 Annual Report Download - page 25
Download and view the complete annual report
Please find page 25 of the 2014 Kraft annual report below. You can navigate through the pages in the report by either clicking on the pages listed below, or by using the keyword search tool below to find specific information within the annual report.-
 1
1 -
2
-
3
-
4
-
5
-
6
-
7
-
8
-
9
-
10
-
11
-
12
-
13
-
14
-
 15
15 -
 16
16 -
 17
17 -
 18
18 -
 19
19 -
 20
20 -
 21
21 -
 22
22 -
 23
23 -
 24
24 -
 25
25 -
 26
26 -
 27
27 -
 28
28 -
 29
29 -
 30
30 -
 31
31 -
 32
32 -
 33
33 -
 34
34 -
 35
35 -
36
-
37
-
38
-
39
-
40
-
41
-
42
-
43
-
44
-
45
-
46
-
47
-
48
-
49
-
50
-
51
-
52
-
53
-
54
-
55
-
56
-
57
-
58
-
59
-
60
-
61
-
62
-
63
-
64
-
65
-
66
-
67
-
68
-
69
-
70
-
71
-
72
-
73
-
74
-
75
-
76
-
77
-
78
-
79
-
80
-
81
-
82
-
83
-
84
-
85
-
86
-
87
-
88
-
89
-
90
-
91
-
92
-
93
-
94
-
95
-
96
-
97
-
98
-
99
-
100
-
101
-
102
-
103
-
104
-
105
-
106
-
107
-
108
-
109
-
110
-
111
-
112
-
113
-
114
-
115
-
116
-
117
-
118
-
119
-
120
-
121
-
122
-
123
-
124
-
125
-
126
-
127
-
128
-
129
-
130
-
131
-
132
-
133
-
134
-
135
-
136
-
137
-
138
-
139
-
140
-
141
-
142
-
143
-
144
-
145
-
146
-
147
-
148
-
149
-
150
-
151
-
152
-
153
-
154
-
155
-
156
-
157
-
158
-
159
-
160
-
161
-
162
-
163
-
164
-
165
-
166
-
167
-
168
-
169
-
170
 |
 |

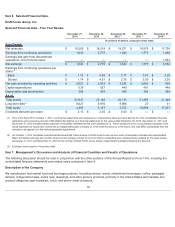
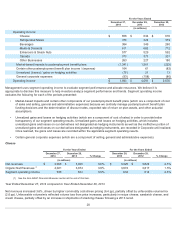
Management uses segment operating income to evaluate segment performance and allocate resources. We believe it is
appropriate to disclose this measure to help investors analyze segment performance and trends. Segment operating income
excludes the following for each of the periods presented:
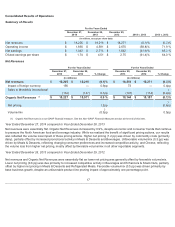
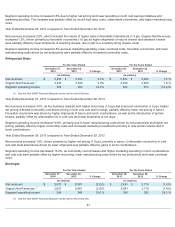
Cheese
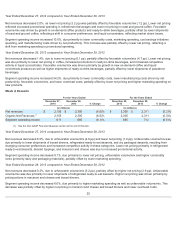
Year Ended December 27, 2014 compared to Year Ended December 28, 2013
Net revenues increased 3.6%, driven by higher commodity cost-driven pricing (6.4 pp), partially offset by unfavorable volume/mix
(2.6 pp). Unfavorable volume/mix reflected volume loss from price increases, particularly in recipe cheese, sandwich cheese, and
cream cheese, partially offset by an increase in shipments of snacking cheese following a 2013 recall.
20
For the Years Ended
December 27,
2014 December 28,
2013 December 29,
2012
(in millions)
Operating income:
Cheese $ 656 $ 634 $ 618
Refrigerated Meals 378 329 379
Beverages 384 349 260
Meals & Desserts 611 665 712
Enhancers & Snack Nuts 577 529 592
Canada 370 373 301
Other Businesses 263 227 180
Market-based impacts to postemployment benefit plans (1,341 ) 1,561 (223 )
Certain other postemployment benefit plan income / (expense) 164 61 (82 )
Unrealized (losses) / gains on hedging activities (79 ) 21 13
General corporate expenses (93 ) (158 ) (80 )
Operating income $1,890 $4,591 $2,670
• Market-based impacts and certain other components of our postemployment benefit plans (which are a component of cost
of sales and selling, general and administrative expenses) because we centrally manage postemployment benefit plan
funding decisions and the determination of discount rates, expected rate of return on plan assets, and other actuarial
assumptions.
• Unrealized gains and losses on hedging activities (which are a component of cost of sales) in order to provide better
transparency of our segment operating results. Unrealized gains and losses on hedging activities, which includes
unrealized gains and losses on our derivatives not designated as hedging instruments as well as the ineffective portion of
unrealized gains and losses on our derivatives designated as hedging instruments, are recorded in Corporate until realized.
Once realized, the gains and losses are recorded within the applicable segment operating results.
• Certain general corporate expenses (which are a component of selling, general and administrative expenses).
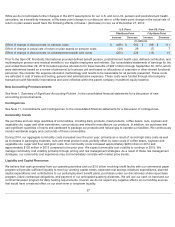
For the Years Ended For the Years Ended
December 27,
2014
December 28,
2013 % Change
December 28,
2013
December 29,
2012 % Change
(in millions) (in millions)
Net revenues $4,066 $ 3,925 3.6 % $ 3,925 $ 3,829 2.5%
Organic Net Revenues
(1)
4,021 3,874 3.8 % 3,874 3,817 1.5%
Segment operating income 656 634 3.5 % 634 618 2.6%
(1) See the Non-GAAP Financial Measures section at the end of this item.