Kraft 2014 Annual Report Download - page 24
Download and view the complete annual report
Please find page 24 of the 2014 Kraft annual report below. You can navigate through the pages in the report by either clicking on the pages listed below, or by using the keyword search tool below to find specific information within the annual report.-
 1
1 -
2
-
3
-
4
-
5
-
6
-
7
-
8
-
9
-
10
-
11
-
12
-
13
-
 14
14 -
 15
15 -
 16
16 -
 17
17 -
 18
18 -
 19
19 -
 20
20 -
 21
21 -
 22
22 -
 23
23 -
 24
24 -
 25
25 -
 26
26 -
 27
27 -
 28
28 -
 29
29 -
 30
30 -
 31
31 -
 32
32 -
 33
33 -
 34
34 -
35
-
36
-
37
-
38
-
39
-
40
-
41
-
42
-
43
-
44
-
45
-
46
-
47
-
48
-
49
-
50
-
51
-
52
-
53
-
54
-
55
-
56
-
57
-
58
-
59
-
60
-
61
-
62
-
63
-
64
-
65
-
66
-
67
-
68
-
69
-
70
-
71
-
72
-
73
-
74
-
75
-
76
-
77
-
78
-
79
-
80
-
81
-
82
-
83
-
84
-
85
-
86
-
87
-
88
-
89
-
90
-
91
-
92
-
93
-
94
-
95
-
96
-
97
-
98
-
99
-
100
-
101
-
102
-
103
-
104
-
105
-
106
-
107
-
108
-
109
-
110
-
111
-
112
-
113
-
114
-
115
-
116
-
117
-
118
-
119
-
120
-
121
-
122
-
123
-
124
-
125
-
126
-
127
-
128
-
129
-
130
-
131
-
132
-
133
-
134
-
135
-
136
-
137
-
138
-
139
-
140
-
141
-
142
-
143
-
144
-
145
-
146
-
147
-
148
-
149
-
150
-
151
-
152
-
153
-
154
-
155
-
156
-
157
-
158
-
159
-
160
-
161
-
162
-
163
-
164
-
165
-
166
-
167
-
168
-
169
-
170
 |
 |

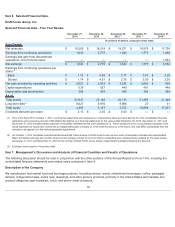
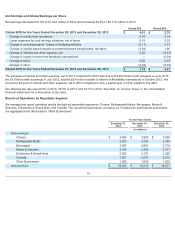
Net Earnings and Diluted Earnings per Share
Net earnings decreased 61.6% to $1,043 million in 2014 and increased 65.3% to $2,715 million in 2013.
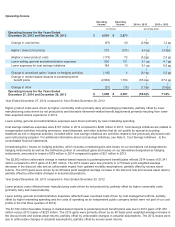
The increase in interest and other expense, net in 2013 compared to 2012 was due to the $6.0 billion debt issuance in June 2012,
the $3.6 billion debt exchange in July 2012, and the $0.4 billion transfer of debt from MondelƝz International in October 2012. We
incurred a full year of interest and other expense, net in 2013 compared to only a partial year in 2012 related to this debt.
Our effective tax rate was 25.8% in 2014, 33.6% in 2013, and 33.1% in 2012. See Note 12, Income Taxes, to the consolidated
financial statements for a discussion of tax rates.
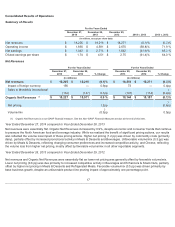
Results of Operations by Reportable Segment
We manage and report operating results through six reportable segments: Cheese, Refrigerated Meals, Beverages, Meals &
Desserts, Enhancers & Snack Nuts, and Canada. Our remaining businesses, including our Foodservice and Exports businesses,
are aggregated and disclosed as “Other Businesses”.
19
Diluted EPS Diluted EPS
Diluted EPS for the Years Ended December 28, 2013 and December 29, 2012 $4.51 $2.75
Change in results from operations 0.16 0.14
Lower expenses for cost savings initiatives, net of taxes 0.18 0.02
Change in unrealized gains / losses on hedging activities (0.11 ) 0.01
Change in market-based impacts to postemployment benefit plans, net taxes (3.08 ) 1.90
Change in interest and other expense, net 0.02 (0.27 )
Change in royalty income from MondelƝz International — (0.04 )
Change in taxes 0.08 0.03
Change in other (0.02 ) (0.03 )
Diluted EPS for the Years Ended December 27, 2014 and December 28, 2013 $1.74 $4.51
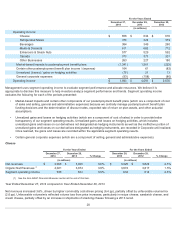
For the Years Ended
December 27,
2014
December 28,
2013
December 29,
2012
(in millions)
Net revenues:
Cheese $ 4,066
$ 3,925 $ 3,829
Refrigerated Meals 3,433 3,334 3,280
Beverages 2,627
2,681 2,718
Meals & Desserts 2,155 2,305 2,311
Enhancers & Snack Nuts 2,062 2,101 2,220
Canada 1,937 2,037 2,010
Other Businesses 1,925 1,835 1,903
Net revenues $18,205 $18,218 $18,271