Kraft 2014 Annual Report Download - page 58
Download and view the complete annual report
Please find page 58 of the 2014 Kraft annual report below. You can navigate through the pages in the report by either clicking on the pages listed below, or by using the keyword search tool below to find specific information within the annual report.-
 1
1 -
2
-
3
-
4
-
5
-
6
-
7
-
8
-
9
-
10
-
11
-
12
-
13
-
14
-
15
-
16
-
17
-
18
-
19
-
20
-
21
-
22
-
23
-
24
-
25
-
26
-
27
-
28
-
29
-
30
-
31
-
32
-
33
-
34
-
35
-
36
-
37
-
38
-
39
-
40
-
41
-
42
-
43
-
44
-
45
-
46
-
47
-
 48
48 -
 49
49 -
 50
50 -
 51
51 -
 52
52 -
 53
53 -
 54
54 -
 55
55 -
 56
56 -
 57
57 -
 58
58 -
 59
59 -
 60
60 -
 61
61 -
 62
62 -
 63
63 -
 64
64 -
 65
65 -
 66
66 -
 67
67 -
 68
68 -
69
-
70
-
71
-
72
-
73
-
74
-
75
-
76
-
77
-
78
-
79
-
80
-
81
-
82
-
83
-
84
-
85
-
86
-
87
-
88
-
89
-
90
-
91
-
92
-
93
-
94
-
95
-
96
-
97
-
98
-
99
-
100
-
101
-
102
-
103
-
104
-
105
-
106
-
107
-
108
-
109
-
110
-
111
-
112
-
113
-
114
-
115
-
116
-
117
-
118
-
119
-
120
-
121
-
122
-
123
-
124
-
125
-
126
-
127
-
128
-
129
-
130
-
131
-
132
-
133
-
134
-
135
-
136
-
137
-
138
-
139
-
140
-
141
-
142
-
143
-
144
-
145
-
146
-
147
-
148
-
149
-
150
-
151
-
152
-
153
-
154
-
155
-
156
-
157
-
158
-
159
-
160
-
161
-
162
-
163
-
164
-
165
-
166
-
167
-
168
-
169
-
170
 |
 |

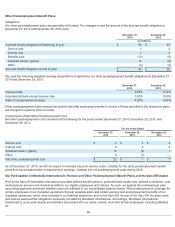
in selling, general and administrative expenses. The annual remeasurement resulted in a benefit from market-based impacts of $29
million as of December 29, 2012.
In addition, as a result of the December 28, 2013 remeasurement, we capitalized an aggregate benefit of $34 million from market-
based impacts related to our pension plans into inventory consistent with our capitalization policy. During 2014, the entire benefit
previously capitalized was recognized in cost of sales. At December 27, 2014, we capitalized an aggregate expense of $41 million
from market-based impacts into inventory.
Net pension costs included settlement losses of $69 million in 2013 related to retiring employees who elected lump-sum payments.
Net pension costs also included special termination benefits associated with our voluntary early retirement program of $62 million in
2013, which were included in our Restructuring Program.
As of December 27, 2014, we expected to amortize an estimated $7 million of prior service costs from accumulated other
comprehensive earnings / (losses) into net periodic pension cost for the combined U.S. and non-U.S. pension plans during 2015.
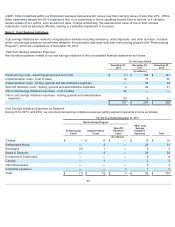
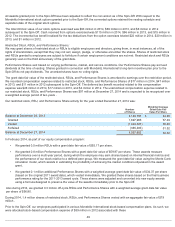
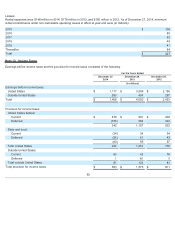
We used the following weighted average assumptions to determine our net pension cost for the years ended December 27, 2014,
December 28, 2013, and December 29, 2012:
Year-end discount rates for our U.S. and non-U.S. plans were developed from a model portfolio of high quality, fixed-income debt
instruments with durations that match the expected future cash flows of the benefit obligations. We determine our expected rate of
return on plan assets from the plan assets’ historical long-term investment performance, current and future asset allocation, and
estimates of future long-term returns by asset class.
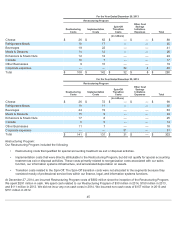
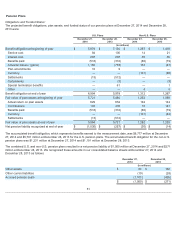
Plan Assets:
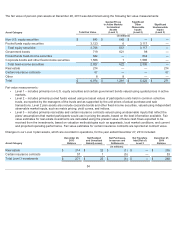
The fair value of pension plan assets at December 27, 2014 was determined using the following fair value measurements:
53
U.S. Plans Non-U.S. Plans
December 27,
2014
December 28,
2013
December 29,
2012
December 27,
2014
December 28,
2013
December 29,
2012
Discount rate 4.86 % 4.34 % 3.85 % 4.56 % 4.00 % 4.03 %
Expected rate of return on
plan assets 5.75 % 5.75 % 8.00 % 5.00 % 5.00 % 7.04 %
Rate of compensation
increase 4.00 % 4.00 % 4.00 % 3.00 % 3.00 % 3.00 %
Asset Category Total Fair Value
Quoted Prices
in Active Markets
for Identical
Assets
(Level 1)
Significant
Other
Observable
Inputs
(Level 2)
Significant
Unobservable
Inputs
(Level 3)
(in millions)
Non-U.S. equity securities $544 $526 $ 18 $ —
Pooled funds equity securities 2,694 6 2,688 —
Total equity securities 3,238 532 2,706 —
Government bonds 776 625 151 —
Pooled funds fixed-income securities 876 — 876 —
Corporate bonds and other fixed-income securities 2,061 — 2,061 —
Total fixed-income securities 3,713 625 3,088 —
Real estate 235 — — 235
Certain insurance contracts 53 — — 53
Other 7
7 — —
Total $7,246 $1,164 $ 5,794 $288