Kraft 2014 Annual Report Download - page 60
Download and view the complete annual report
Please find page 60 of the 2014 Kraft annual report below. You can navigate through the pages in the report by either clicking on the pages listed below, or by using the keyword search tool below to find specific information within the annual report.-
 1
1 -
2
-
3
-
4
-
5
-
6
-
7
-
8
-
9
-
10
-
11
-
12
-
13
-
14
-
15
-
16
-
17
-
18
-
19
-
20
-
21
-
22
-
23
-
24
-
25
-
26
-
27
-
28
-
29
-
30
-
31
-
32
-
33
-
34
-
35
-
36
-
37
-
38
-
39
-
40
-
41
-
42
-
43
-
44
-
45
-
46
-
47
-
48
-
49
-
 50
50 -
 51
51 -
 52
52 -
 53
53 -
 54
54 -
 55
55 -
 56
56 -
 57
57 -
 58
58 -
 59
59 -
 60
60 -
 61
61 -
 62
62 -
 63
63 -
 64
64 -
 65
65 -
 66
66 -
 67
67 -
 68
68 -
 69
69 -
 70
70 -
71
-
72
-
73
-
74
-
75
-
76
-
77
-
78
-
79
-
80
-
81
-
82
-
83
-
84
-
85
-
86
-
87
-
88
-
89
-
90
-
91
-
92
-
93
-
94
-
95
-
96
-
97
-
98
-
99
-
100
-
101
-
102
-
103
-
104
-
105
-
106
-
107
-
108
-
109
-
110
-
111
-
112
-
113
-
114
-
115
-
116
-
117
-
118
-
119
-
120
-
121
-
122
-
123
-
124
-
125
-
126
-
127
-
128
-
129
-
130
-
131
-
132
-
133
-
134
-
135
-
136
-
137
-
138
-
139
-
140
-
141
-
142
-
143
-
144
-
145
-
146
-
147
-
148
-
149
-
150
-
151
-
152
-
153
-
154
-
155
-
156
-
157
-
158
-
159
-
160
-
161
-
162
-
163
-
164
-
165
-
166
-
167
-
168
-
169
-
170
 |
 |

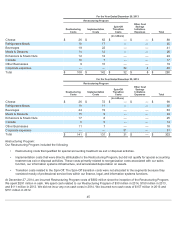
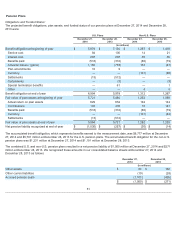
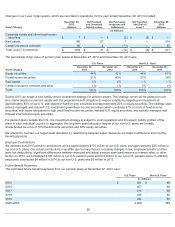
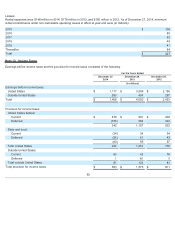
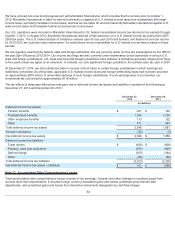
Changes in our Level 3 plan assets, which are recorded in operations, for the year ended December 28, 2013 included:
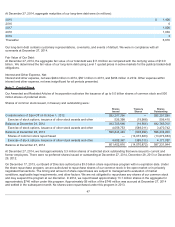
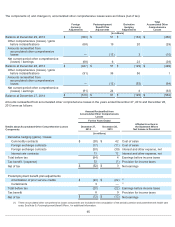
The percentage of fair value of pension plan assets at December 27, 2014 and December 28, 2013 was:
During 2013, we began a new liability-driven investment strategy for pension assets. This strategy, which will be phased in over
time, better aligns our pension assets with the projected benefit obligation to reduce volatility by targeting an investment of
approximately 80% of our U.S. plan assets in fixed-income securities and approximately 20% in equity securities. The strategy uses
actively managed and indexed U.S. investment grade fixed-income securities (which constitute 97% or more of fixed-income
securities) with lesser allocations to high yield fixed-income securities, indexed U.S. equity securities, and actively managed and
indexed international equity securities.
For pension plans outside the U.S., the investment strategy is subject to local regulations and the asset / liability profiles of the
plans in each individual country. In aggregate, the long-term asset allocation targets of our non-U.S. plans are broadly
characterized as a mix of 70% fixed-income securities and 30% equity securities.
We attempt to maintain our target asset allocation by rebalancing between asset classes as we make contributions and monthly
benefit payments.
Employer Contributions:
We estimate that 2015 pension contributions will be approximately $170 million to our U.S. plans and approximately $25 million to
our non-U.S. plans. Our actual contributions may differ due to many factors, including changes in tax, employee benefit, or other
laws, tax deductibility, significant differences between expected and actual pension asset performance or interest rates, or other
factors. In 2014, we contributed $145 million to our U.S. pension plans and $12 million to our non-U.S. pension plans. In addition,
employees contributed $4 million in 2014 to our non-U.S. plans and $5 million in 2013.
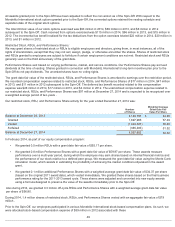
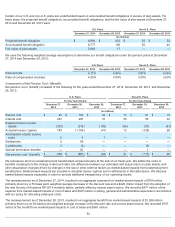
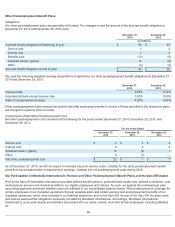
Future Benefit Payments:
The estimated future benefit payments from our pension plans at December 27, 2014 were:
55
Asset Category
December 29,
2012
Balance
Net Realized
and Unrealized
Gains/(Losses)
Net Purchases,
Issuances and
Settlements
Net Transfers
Into/(Out of)
Level 3
December 28,
2013
Balance
(in millions)
Corporate bonds and other fixed-income
securities $ 7 $ — $(2 ) $(5) $ —
Real estate 186 27 1 — 214
Certain insurance contracts 66 4 (13) — 57
Total Level 3 investments $ 259
$ 31
$(14 ) $(5)
$ 271
U.S. Plans Non-U.S. Plans
Asset Category
December 27,
2014
December 28,
2013
December 27,
2014
December 28,
2013
Equity securities 44 % 52 % 48% 61%
Fixed-income securities 51 % 43 % 51% 38%
Real estate 4 % 4% —% —%
Certain insurance contracts and other 1 % 1% 1 % 1 %
Total 100 % 100 % 100 % 100 %
U.S. Plans Non-U.S. Plans
(in millions)
2015 $ 401 $66
2016 407 66
2017 418 66
2018 426 66
2019 434 67
2020-2024 2,268 355