Kraft 2014 Annual Report Download - page 59
Download and view the complete annual report
Please find page 59 of the 2014 Kraft annual report below. You can navigate through the pages in the report by either clicking on the pages listed below, or by using the keyword search tool below to find specific information within the annual report.-
 1
1 -
2
-
3
-
4
-
5
-
6
-
7
-
8
-
9
-
10
-
11
-
12
-
13
-
14
-
15
-
16
-
17
-
18
-
19
-
20
-
21
-
22
-
23
-
24
-
25
-
26
-
27
-
28
-
29
-
30
-
31
-
32
-
33
-
34
-
35
-
36
-
37
-
38
-
39
-
40
-
41
-
42
-
43
-
44
-
45
-
46
-
47
-
48
-
 49
49 -
 50
50 -
 51
51 -
 52
52 -
 53
53 -
 54
54 -
 55
55 -
 56
56 -
 57
57 -
 58
58 -
 59
59 -
 60
60 -
 61
61 -
 62
62 -
 63
63 -
 64
64 -
 65
65 -
 66
66 -
 67
67 -
 68
68 -
 69
69 -
70
-
71
-
72
-
73
-
74
-
75
-
76
-
77
-
78
-
79
-
80
-
81
-
82
-
83
-
84
-
85
-
86
-
87
-
88
-
89
-
90
-
91
-
92
-
93
-
94
-
95
-
96
-
97
-
98
-
99
-
100
-
101
-
102
-
103
-
104
-
105
-
106
-
107
-
108
-
109
-
110
-
111
-
112
-
113
-
114
-
115
-
116
-
117
-
118
-
119
-
120
-
121
-
122
-
123
-
124
-
125
-
126
-
127
-
128
-
129
-
130
-
131
-
132
-
133
-
134
-
135
-
136
-
137
-
138
-
139
-
140
-
141
-
142
-
143
-
144
-
145
-
146
-
147
-
148
-
149
-
150
-
151
-
152
-
153
-
154
-
155
-
156
-
157
-
158
-
159
-
160
-
161
-
162
-
163
-
164
-
165
-
166
-
167
-
168
-
169
-
170
 |
 |

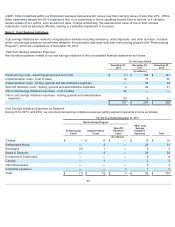
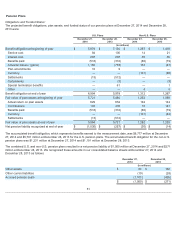
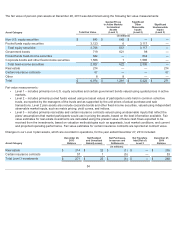
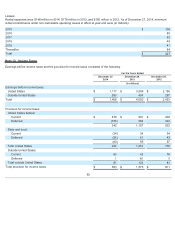
The fair value of pension plan assets at December 28, 2013 was determined using the following fair value measurements:
Fair value measurements:
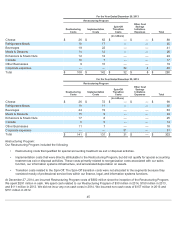
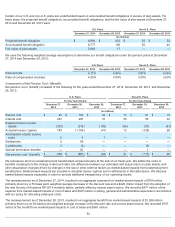
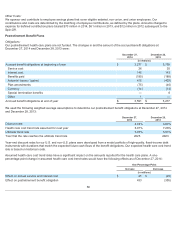
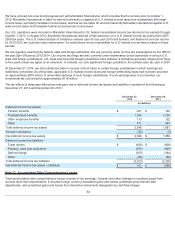
Changes in our Level 3 plan assets, which are recorded in operations, for the year ended December 27, 2014 included:
54
Asset Category Total Fair Value
Quoted Prices
in Active Markets
for Identical
Assets
(Level 1)
Significant
Other
Observable
Inputs
(Level 2)
Significant
Unobservable
Inputs
(Level 3)
(in millions)
Non-U.S. equity securities $645 $645 $ — $ —
Pooled funds equity securities 3,123 6 3,117 —
Total equity securities 3,768 651 3,117 —
Government bonds 719 621 98 —
Pooled funds fixed-income securities 642 — 642 —
Corporate bonds and other fixed-income securities 1,566 1 1,565 —
Total fixed-income securities 2,927 622 2,305 —
Real estate 214 — — 214
Certain insurance contracts 57 — — 57
Other 8
8 — —
Total $6,974 $1,281 $ 5,422 $271
• Level 1 – includes primarily non-U.S. equity securities and certain government bonds valued using quoted prices in active
markets.
• Level 2 – includes primarily pooled funds valued using net asset values of participation units held in common collective
trusts, as reported by the managers of the trusts and as supported by the unit prices of actual purchase and sale
transactions. Level 2 plan assets also include corporate bonds and other fixed-income securities, valued using independent
observable market inputs, such as matrix pricing, yield curves, and indices.
• Level 3 – includes primarily real estate and certain insurance contracts valued using unobservable inputs that reflect the
plans’ assumptions that market participants would use in pricing the assets, based on the best information available. Fair
value estimates for real estate investments are calculated using the present value of future cash flows expected to be
received from the investments, based on valuation methodologies such as appraisals, local market conditions, and current
and projected operating performance. Fair value estimates for certain insurance contracts are reported at contract value.
Asset Category
December 28,
2013
Balance
Net Realized
and Unrealized
Gains/(Losses)
Net Purchases,
Issuances and
Settlements
Net Transfers
Into/(Out of)
Level 3
December 27,
2014
Balance
(in millions)
Real estate $ 214 $ 22 $(1 ) $ — $235
Certain insurance contracts 57 1 (5 ) — 53
Total Level 3 investments $ 271 $ 23 $(6 ) $ — $288