Kraft 2014 Annual Report Download - page 30
Download and view the complete annual report
Please find page 30 of the 2014 Kraft annual report below. You can navigate through the pages in the report by either clicking on the pages listed below, or by using the keyword search tool below to find specific information within the annual report.-
 1
1 -
2
-
3
-
4
-
5
-
6
-
7
-
8
-
9
-
10
-
11
-
12
-
13
-
14
-
15
-
16
-
17
-
18
-
19
-
 20
20 -
 21
21 -
 22
22 -
 23
23 -
 24
24 -
 25
25 -
 26
26 -
 27
27 -
 28
28 -
 29
29 -
 30
30 -
 31
31 -
 32
32 -
 33
33 -
 34
34 -
 35
35 -
 36
36 -
 37
37 -
 38
38 -
 39
39 -
 40
40 -
41
-
42
-
43
-
44
-
45
-
46
-
47
-
48
-
49
-
50
-
51
-
52
-
53
-
54
-
55
-
56
-
57
-
58
-
59
-
60
-
61
-
62
-
63
-
64
-
65
-
66
-
67
-
68
-
69
-
70
-
71
-
72
-
73
-
74
-
75
-
76
-
77
-
78
-
79
-
80
-
81
-
82
-
83
-
84
-
85
-
86
-
87
-
88
-
89
-
90
-
91
-
92
-
93
-
94
-
95
-
96
-
97
-
98
-
99
-
100
-
101
-
102
-
103
-
104
-
105
-
106
-
107
-
108
-
109
-
110
-
111
-
112
-
113
-
114
-
115
-
116
-
117
-
118
-
119
-
120
-
121
-
122
-
123
-
124
-
125
-
126
-
127
-
128
-
129
-
130
-
131
-
132
-
133
-
134
-
135
-
136
-
137
-
138
-
139
-
140
-
141
-
142
-
143
-
144
-
145
-
146
-
147
-
148
-
149
-
150
-
151
-
152
-
153
-
154
-
155
-
156
-
157
-
158
-
159
-
160
-
161
-
162
-
163
-
164
-
165
-
166
-
167
-
168
-
169
-
170
 |
 |

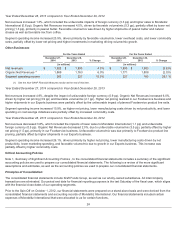
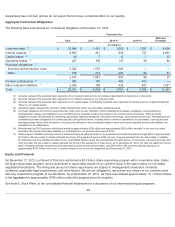
including general corporate expenses related to finance, legal, information technology, human resources, compliance, shared
services, insurance, employee benefits and incentives, and stock-based compensation. These expenses were allocated in our
historical results of operations on the basis of direct usage when identifiable, with the remainder allocated on the basis of revenue,
operating income, or headcount. We consider the expense allocation methodology and results to be reasonable for all periods
presented. However, these allocations were not necessarily indicative of the actual expenses we would have incurred as an
independent public company or of the costs we will incur in the future, and may differ substantially from the allocations we agreed to
in the various separation agreements.
Revenue Recognition:
We recognize revenues when title and risk of loss pass to our customers. We record revenues net of consumer incentives and
trade promotions and include all shipping and handling charges billed to customers. We also record provisions for estimated
product returns and customer allowances as reductions to revenues within the same period that the revenue is recognized. We
base these estimates principally on historical and current period experience, however, it is reasonably likely that actual experience
will vary from the estimates we have made.
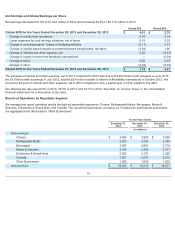
Marketing and Research and Development:
We promote our products with advertising and consumer promotions, consumer incentives, and trade promotions. Consumer
incentives and trade promotions include, but are not limited to, discounts, coupons, rebates, in-store display incentives, and
volume-based incentives. Consumer incentive and trade promotion activities are recorded as a reduction to revenues based on
amounts estimated as being due to customers and consumers at the end of a period. We base these estimates principally on
historical utilization and redemption rates.
For interim reporting purposes, we charge advertising and consumer promotion expenses to operations as a percentage of volume,
based on estimated volume and related expense for the full year. We review and adjust these estimates each quarter based on
actual experience and other information. Advertising expense was $652 million in 2014, $747 million in 2013, and $640 million in
2012. We record marketing expense in selling, general and administrative expense, except for consumer incentives and trade
promotions, which are recorded in net revenues.
We expense costs as incurred for product research and development within selling, general and administrative expenses. Research
and development expense was $149 million in 2014, $142 million in 2013, and $143 million in 2012. The amounts disclosed in prior
periods have been revised to conform with the current year presentation.
Income Taxes:
We recognize income taxes based on amounts refundable or payable for the current year and record deferred tax assets or
liabilities for any difference between accounting principles generally accepted in the United States of America (“U.S. GAAP”) and
tax reporting. We also recognize deferred tax assets for temporary differences, operating loss carryforwards, and tax credit
carryforwards. Inherent in determining our annual tax rate are judgments regarding business plans, planning opportunities, and
expectations about future outcomes. Realization of certain deferred tax assets, primarily net operating loss and other carryforwards,
is dependent upon generating sufficient taxable income in the appropriate jurisdiction prior to the expiration of the carryforward
periods. See Note 12, Income Taxes , to the consolidated financial statements for additional information.
We apply a more-likely-than-not threshold to the recognition and derecognition of uncertain tax positions. Accordingly, we recognize
the amount of tax benefit that has a greater than 50 percent likelihood of being ultimately realized upon settlement. Future changes
in judgment related to the expected ultimate resolution of uncertain tax positions will affect earnings in the quarter of such change.
Goodwill and Intangible Assets:
We test goodwill and indefinite-lived intangible assets for impairment at least annually in the fourth quarter or when a triggering
event occurs. The first step of the goodwill impairment test compares the reporting unit’s estimated fair value with its carrying value.
We estimate a reporting unit’s fair value using planned growth rates, market-based discount rates, estimates of residual value, and
estimates of market multiples. If the carrying value of a reporting unit’s net assets exceeds its fair value, the second step would be
applied to measure the difference between the carrying value and implied fair value of goodwill. If the carrying value of goodwill
exceeds its implied fair value, the goodwill would be considered impaired and reduced to its implied fair value.
25