Kraft 2014 Annual Report Download - page 49
Download and view the complete annual report
Please find page 49 of the 2014 Kraft annual report below. You can navigate through the pages in the report by either clicking on the pages listed below, or by using the keyword search tool below to find specific information within the annual report.-
 1
1 -
2
-
3
-
4
-
5
-
6
-
7
-
8
-
9
-
10
-
11
-
12
-
13
-
14
-
15
-
16
-
17
-
18
-
19
-
20
-
21
-
22
-
23
-
24
-
25
-
26
-
27
-
28
-
29
-
30
-
31
-
32
-
33
-
34
-
35
-
36
-
37
-
38
-
 39
39 -
 40
40 -
 41
41 -
 42
42 -
 43
43 -
 44
44 -
 45
45 -
 46
46 -
 47
47 -
 48
48 -
 49
49 -
 50
50 -
 51
51 -
 52
52 -
 53
53 -
 54
54 -
 55
55 -
 56
56 -
 57
57 -
 58
58 -
 59
59 -
60
-
61
-
62
-
63
-
64
-
65
-
66
-
67
-
68
-
69
-
70
-
71
-
72
-
73
-
74
-
75
-
76
-
77
-
78
-
79
-
80
-
81
-
82
-
83
-
84
-
85
-
86
-
87
-
88
-
89
-
90
-
91
-
92
-
93
-
94
-
95
-
96
-
97
-
98
-
99
-
100
-
101
-
102
-
103
-
104
-
105
-
106
-
107
-
108
-
109
-
110
-
111
-
112
-
113
-
114
-
115
-
116
-
117
-
118
-
119
-
120
-
121
-
122
-
123
-
124
-
125
-
126
-
127
-
128
-
129
-
130
-
131
-
132
-
133
-
134
-
135
-
136
-
137
-
138
-
139
-
140
-
141
-
142
-
143
-
144
-
145
-
146
-
147
-
148
-
149
-
150
-
151
-
152
-
153
-
154
-
155
-
156
-
157
-
158
-
159
-
160
-
161
-
162
-
163
-
164
-
165
-
166
-
167
-
168
-
169
-
170
 |
 |
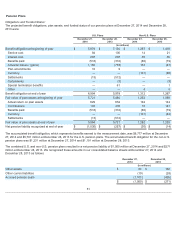
a $261 million trademark within our Enhancers business had excess fair values over their carrying values of less than 20% . While
these trademarks passed the 2014 impairment test, if our projections of future operating income were to decline, or if valuation
factors outside of our control, such as discount rates, change unfavorably, the estimated fair value of one or both of these
trademarks could be adversely affected, leading to a potential impairment in the future.
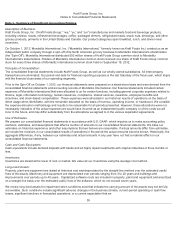
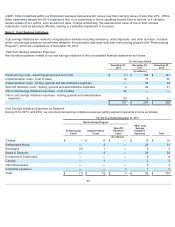
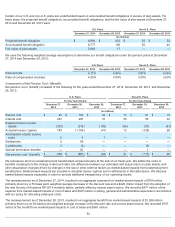
Note 5. Cost Savings Initiatives
Cost savings initiatives are related to reorganization activities including severance, asset disposals, and other activities. Included
within cost savings initiatives are activities related to the previously disclosed multi-year restructuring program (the "Restructuring
Program"), which we completed as of December 27, 2014.
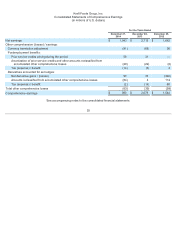
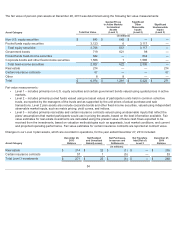
Total Cost Savings Initiatives Expenses:
We recorded expenses related to our cost savings initiatives in the consolidated financial statements as follows:
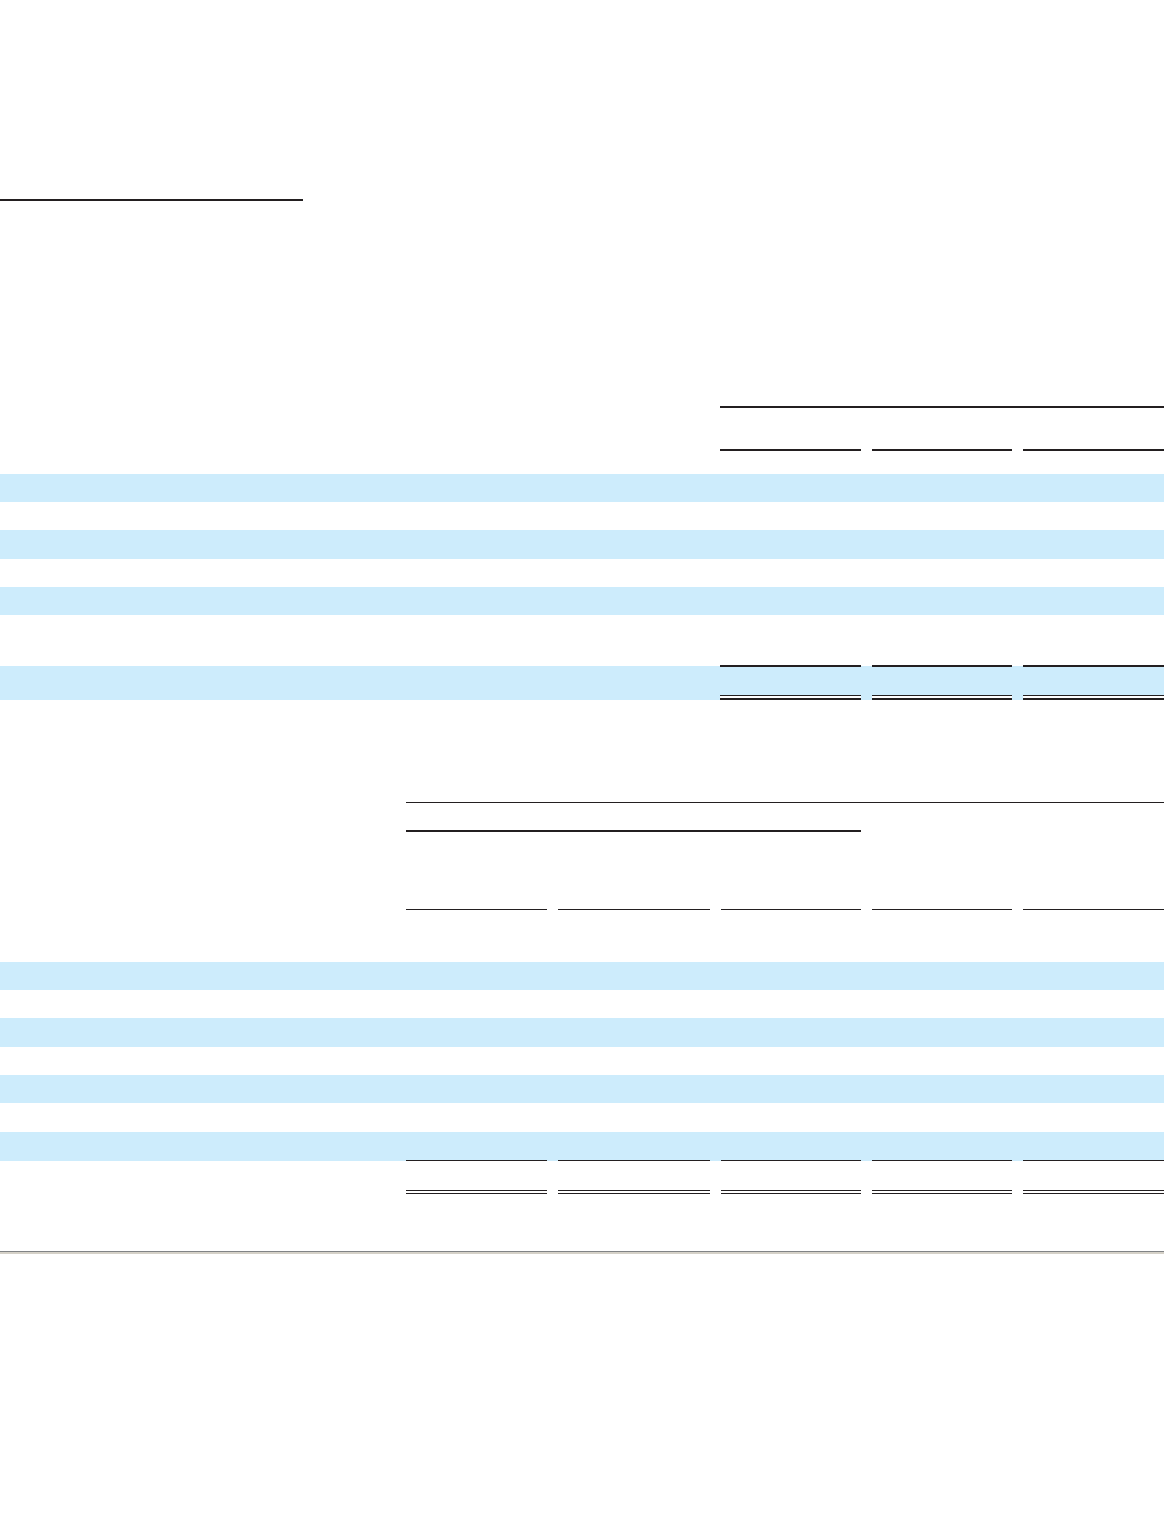
Cost Savings Initiatives Expenses by Segment:
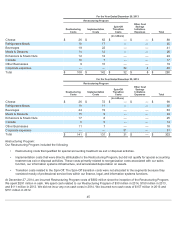
During 2014, 2013, and 2012, we recorded cost savings initiatives expenses within segment operating income as follows:
44
For the Years Ended
December 27,
2014
December 28,
2013
December 29,
2012
(in millions)
Restructuring costs - Asset impairment and exit costs $(1 ) $108 $141
Implementation costs - Cost of sales 12 77 97
Implementation costs - Selling, general and administrative expenses — 65 34
Spin-Off transition costs - Selling, general and administrative expenses 4 32 31
Other cost savings initiatives expenses - Cost of sales 49 — —
Other cost savings initiatives expenses - Selling, general and administrative
expenses 43 8 —
$107 $290 $303
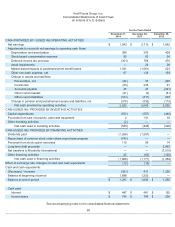
For the Year Ended December 27, 2014
Restructuring Program
Restructuring
Costs
Implementation
Costs
Spin-Off
Transition
Costs
Other Cost
Savings
Initiatives
Expenses Total
(in millions)
Cheese $ 1 $6 $— $12 $19
Refrigerated Meals — 2 — 29 31
Beverages (2 ) 1 — 9 8
Meals & Desserts — 2 — 28 30
Enhancers & Snack Nuts — — — 8 8
Canada — 1 — 2 3
Other Businesses — — — 3 3
Corporate expenses — — 4 1 5
Total $(1 ) $12
$4
$92
$ 107