Kraft 2014 Annual Report Download - page 21
Download and view the complete annual report
Please find page 21 of the 2014 Kraft annual report below. You can navigate through the pages in the report by either clicking on the pages listed below, or by using the keyword search tool below to find specific information within the annual report.-
 1
1 -
2
-
3
-
4
-
5
-
6
-
7
-
8
-
9
-
10
-
 11
11 -
 12
12 -
 13
13 -
 14
14 -
 15
15 -
 16
16 -
 17
17 -
 18
18 -
 19
19 -
 20
20 -
 21
21 -
 22
22 -
 23
23 -
 24
24 -
 25
25 -
 26
26 -
 27
27 -
 28
28 -
 29
29 -
 30
30 -
 31
31 -
32
-
33
-
34
-
35
-
36
-
37
-
38
-
39
-
40
-
41
-
42
-
43
-
44
-
45
-
46
-
47
-
48
-
49
-
50
-
51
-
52
-
53
-
54
-
55
-
56
-
57
-
58
-
59
-
60
-
61
-
62
-
63
-
64
-
65
-
66
-
67
-
68
-
69
-
70
-
71
-
72
-
73
-
74
-
75
-
76
-
77
-
78
-
79
-
80
-
81
-
82
-
83
-
84
-
85
-
86
-
87
-
88
-
89
-
90
-
91
-
92
-
93
-
94
-
95
-
96
-
97
-
98
-
99
-
100
-
101
-
102
-
103
-
104
-
105
-
106
-
107
-
108
-
109
-
110
-
111
-
112
-
113
-
114
-
115
-
116
-
117
-
118
-
119
-
120
-
121
-
122
-
123
-
124
-
125
-
126
-
127
-
128
-
129
-
130
-
131
-
132
-
133
-
134
-
135
-
136
-
137
-
138
-
139
-
140
-
141
-
142
-
143
-
144
-
145
-
146
-
147
-
148
-
149
-
150
-
151
-
152
-
153
-
154
-
155
-
156
-
157
-
158
-
159
-
160
-
161
-
162
-
163
-
164
-
165
-
166
-
167
-
168
-
169
-
170
 |
 |

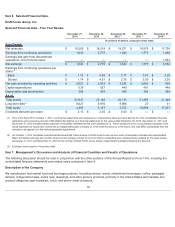
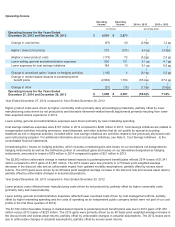
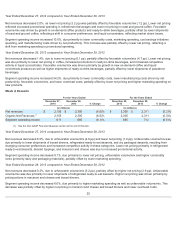
Consolidated Results of Operations
Summary of Results
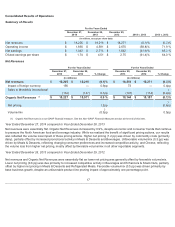
Net Revenues
Year Ended December 27, 2014 compared to Year Ended December 28, 2013
Net revenues were essentially flat. Organic Net Revenues increased by 0.9%, despite economic and consumer trends that continue
to pressure the North American food and beverage industry. While we realized the benefit of significant pricing actions, our results
also reflected the volume loss impact of those pricing actions. Higher net pricing (1.2 pp) was driven by commodity costs (primarily
dairy), partially offset by increased promotional activity in Meals & Desserts and Beverages. Unfavorable volume/mix (0.3 pp) was
driven by Meals & Desserts, reflecting changing consumer preferences and increased competitive activity, and Cheese, reflecting
the volume loss from higher net pricing, mostly offset by favorable volume/mix in all other reportable segments.
Year Ended December 28, 2013 compared to Year Ended December 29, 2012
Net revenues and Organic Net Revenues were essentially flat as lower net pricing was generally offset by favorable volume/mix.
Lower net pricing (0.6 pp) was due primarily to increased competitive activity in Beverages and Enhancers & Snack Nuts, partially
offset by higher net pricing in Meals & Desserts and Refrigerated Meals. Favorable volume/mix (0.5 pp) was driven primarily by
base business growth, despite an unfavorable product line pruning impact of approximately one percentage point.
17
For the Years Ended
December 27,
2014
December 28,
2013
December 29,
2012 2014 v. 2013 2013 v. 2012
(in millions, except per share data)
Net revenues $ 18,205 $ 18,218 $ 18,271 (0.1 )% (0.3 )%
Operating income $ 1,890 $ 4,591
$ 2,670 (58.8 )% 71.9 %
Net earnings $ 1,043 $ 2,715 $ 1,642 (61.6 )% 65.3 %
Diluted earnings per share $ 1.74 $ 4.51
$ 2.75
(61.4 )% 64.0 %
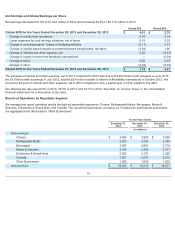
For the Years Ended For the Years Ended
December 27,
2014
December 28,
2013 % Change
December 28,
2013
December 29,
2012 % Change
(in millions) (in millions)
Net revenues $18,205 $18,218 (0.1 )% $18,218 $18,271 (0.3 )%
Impact of foreign currency 156 — 0.9 pp 73 — 0.4 pp
Sales to MondelƝz International
(134 ) (147 ) 0.1 pp (147 ) (114 ) (0.2
)
pp
Organic Net Revenues
(1)
$ 18,227 $ 18,071 0.9 % $ 18,144 $ 18,157 (0.1 )%
Net pricing 1.2 pp (0.6
)
pp
Volume/mix (0.3
)
pp 0.5 pp
(1) Organic Net Revenues is a non-GAAP financial measure. See the Non-GAAP Financial Measures section at the end of this item.