Kraft 2014 Annual Report Download - page 26
Download and view the complete annual report
Please find page 26 of the 2014 Kraft annual report below. You can navigate through the pages in the report by either clicking on the pages listed below, or by using the keyword search tool below to find specific information within the annual report.-
 1
1 -
2
-
3
-
4
-
5
-
6
-
7
-
8
-
9
-
10
-
11
-
12
-
13
-
14
-
15
-
 16
16 -
 17
17 -
 18
18 -
 19
19 -
 20
20 -
 21
21 -
 22
22 -
 23
23 -
 24
24 -
 25
25 -
 26
26 -
 27
27 -
 28
28 -
 29
29 -
 30
30 -
 31
31 -
 32
32 -
 33
33 -
 34
34 -
 35
35 -
 36
36 -
37
-
38
-
39
-
40
-
41
-
42
-
43
-
44
-
45
-
46
-
47
-
48
-
49
-
50
-
51
-
52
-
53
-
54
-
55
-
56
-
57
-
58
-
59
-
60
-
61
-
62
-
63
-
64
-
65
-
66
-
67
-
68
-
69
-
70
-
71
-
72
-
73
-
74
-
75
-
76
-
77
-
78
-
79
-
80
-
81
-
82
-
83
-
84
-
85
-
86
-
87
-
88
-
89
-
90
-
91
-
92
-
93
-
94
-
95
-
96
-
97
-
98
-
99
-
100
-
101
-
102
-
103
-
104
-
105
-
106
-
107
-
108
-
109
-
110
-
111
-
112
-
113
-
114
-
115
-
116
-
117
-
118
-
119
-
120
-
121
-
122
-
123
-
124
-
125
-
126
-
127
-
128
-
129
-
130
-
131
-
132
-
133
-
134
-
135
-
136
-
137
-
138
-
139
-
140
-
141
-
142
-
143
-
144
-
145
-
146
-
147
-
148
-
149
-
150
-
151
-
152
-
153
-
154
-
155
-
156
-
157
-
158
-
159
-
160
-
161
-
162
-
163
-
164
-
165
-
166
-
167
-
168
-
169
-
170
 |
 |

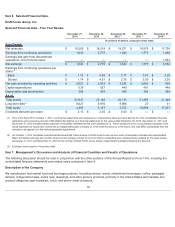
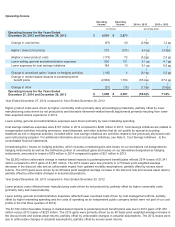
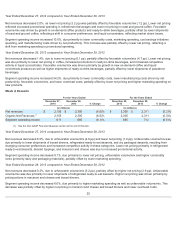
Segment operating income increased 3.5% due to higher net pricing and lower spending on both cost savings initiatives and
marketing activities. This increase was partially offset by record high dairy costs, unfavorable volume/mix, and higher manufacturing
costs.
Year Ended December 28, 2013 compared to Year Ended December 29, 2012
Net revenues increased 2.5%, which included the impact of higher sales to MondelƝz International (1.0 pp). Organic Net Revenues
increased 1.5%, driven primarily by favorable volume/mix (1.6 pp) as higher shipments of natural cheese and sandwich cheese
were partially offset by lower shipments of snacking cheese, due in part to a voluntary string cheese recall.
Segment operating income increased 2.6% as lower marketing spending, lower overhead costs, favorable volume/mix, and lower
manufacturing costs driven by net productivity were partially offset by increased commodity costs.
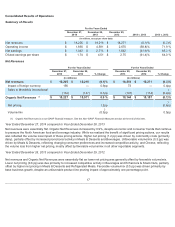
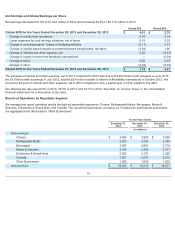
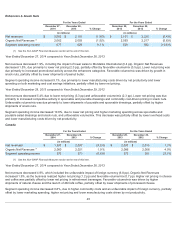
Refrigerated Meals
Year Ended December 27, 2014 compared to Year Ended December 28, 2013
Net revenues increased 3.0%, as the business realized both higher net pricing (1.5 pp) and improved volume/mix (1.5 pp). Higher
net pricing reflected commodity cost-driven pricing in both cold cuts and hot dogs, partially offset by lower net pricing in bacon.
Favorable volume/mix was driven by higher shipments of bacon and lunch combinations, as well as the introduction of protein
snacks, partially offset by unfavorable mix in cold cuts and lower shipments of hot dogs.
Segment operating income increased 14.9%, primarily due to lower manufacturing costs driven by net productivity and higher net
pricing, partially offset by higher commodity costs and increased marketing investments primarily in new protein snacks and in
lunch combinations.
Year Ended December 28, 2013 compared to Year Ended December 29, 2012
Net revenues increased 1.6%, driven primarily by higher net pricing (1.9 pp), primarily in bacon. Unfavorable volume/mix in cold
cuts and meat alternatives driven by lower shipments was partially offset by gains in lunch combinations.
Segment operating income decreased 13.2%, as commodity cost increases and higher marketing spending in lunch combinations
and cold cuts were partially offset by higher net pricing, lower manufacturing costs driven by net productivity and lower overhead
costs.
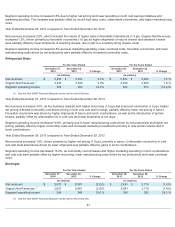
Beverages
21
For the Years Ended For the Years Ended
December 27,
2014 December 28,
2013 % Change December 28,
2013 December 29,
2012 % Change
(in millions) (in millions)
Net revenues $ 3,433 $ 3,334 3.0 % $3,334 $ 3,280 1.6 %
Organic Net Revenues
(1)
3,433 3,334 3.0 % 3,334 3,280 1.6 %
Segment operating income 378 329 14.9 % 329 379 (13.2 )%
(1) See the Non-GAAP Financial Measures section at the end of this item.
For the Years Ended For the Years Ended
December 27,
2014
December 28,
2013 % Change
December 28,
2013
December 29,
2012 % Change
(in millions) (in millions)
Net revenues $2,627 $ 2,681 (2.0 )% $2,681 $2,718 (1.4 )%
Organic Net Revenues
(1)
2,627 2,681 (2.0 )% 2,681 2,718 (1.4 )%
Segment operating income 384 349 10.0 % 349 260 34.2 %
(1) See the Non-GAAP Financial Measures section at the end of this item.