Kraft 2014 Annual Report Download - page 31
Download and view the complete annual report
Please find page 31 of the 2014 Kraft annual report below. You can navigate through the pages in the report by either clicking on the pages listed below, or by using the keyword search tool below to find specific information within the annual report.
We test indefinite-lived intangible assets for impairment by comparing the fair value of each intangible asset with its carrying value.
We determine fair value of non-amortizing intangible assets using planned growth rates, market-based discount rates, and
estimates of royalty rates. If the carrying value exceeds fair value, the intangible asset would be considered impaired and would be
reduced to fair value.
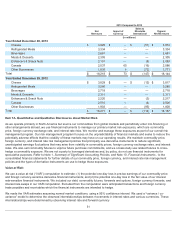
There were no impairments of goodwill or intangible assets in 2014, 2013, or 2012. During our annual 2014 indefinite-lived
intangible asset impairment test, we noted that a $958 million trademark and a $261 million trademark within our Enhancers
business had excess fair values over their carrying values of less than 20% . While these trademarks passed the 2014 impairment
test, if our projections of future operating income were to decline, or if valuation factors outside of our control, such as discount
rates, change unfavorably, the estimated fair value of one or both of these trademarks could be adversely affected, leading to a
potential impairment in the future.
Estimating the fair value of individual reporting units or intangible assets requires us to make assumptions and estimates regarding
our future plans, as well as industry and economic conditions. These assumptions and estimates include projected revenues and
income, interest rates, cost of capital, royalty rates, and tax rates. Many of the factors used in assessing fair value are outside the
control of management and it is reasonably likely that assumptions and estimates will change in future periods. These changes
could result in future impairments.
Postemployment Benefit Plans:
We provide a range of benefits to our employees and retirees. These include pension benefits, postretirement health care benefits,
and other postemployment benefits, consisting primarily of severance. We recognize net actuarial gains or losses and changes in
the fair value of plan assets immediately upon remeasurement, which is at least annually. The calculations of the amounts recorded
require the use of various actuarial assumptions, such as discount rates, assumed rates of return on plan assets, compensation
increases, and turnover rates. We review our actuarial assumptions on an annual basis and make modifications to the assumptions
based on current rates and trends when appropriate. We believe that the assumptions used in recording our pension,
postretirement, and other postemployment benefit plan obligations are reasonable based on our experience and advice from our
actuaries. See Note 9, Postemployment Benefit Plans , to the consolidated financial statements for a discussion of the assumptions
used.
For our postretirement plans, our 2015 health care cost trend rate assumption will be 6.91%. We established this rate based upon
our most recent experience as well as our expectation for health care trend rates going forward. We anticipate that our health care
cost trend rate assumption will be 5.00% by 2023. Assumed health care cost trend rates have a significant effect on the amounts
reported for the health care plans. A one-percentage-point change in assumed health care cost trend rates would have the
following effects as of December 27, 2014:
Our 2015 discount rate assumption is 4.08% for our postretirement plans. Our 2015 discount rate assumption is 4.17% for our U.S.
pension plans and 3.87% for our non-U.S. pension plans. We model these discount rates using a portfolio of high quality, fixed-
income debt instruments with durations that match the expected future cash flows of the benefit obligations. Changes in our
discount rates were primarily the result of changes in bond yields year-over-year.
Our 2015 expected rate of return on plan assets is 5.75% for our U.S. pension plans and 5.00% for our non-U.S. pension plans. We
determine our expected rate of return on plan assets from the plan assets’ historical long-term investment performance, current and
future asset allocation, and estimates of future long-term returns by asset class. We attempt to maintain our target asset allocation
by rebalancing between asset classes as we make contributions and monthly benefit payments.
26
One-Percentage-Point
Increase Decrease
(in millions)
Effect on annual service and interest cost $25 $(20)
Effect on postretirement benefit obligation 433 (355 )


