Kraft 2014 Annual Report Download - page 33
Download and view the complete annual report
Please find page 33 of the 2014 Kraft annual report below. You can navigate through the pages in the report by either clicking on the pages listed below, or by using the keyword search tool below to find specific information within the annual report.-
 1
1 -
2
-
3
-
4
-
5
-
6
-
7
-
8
-
9
-
10
-
11
-
12
-
13
-
14
-
15
-
16
-
17
-
18
-
19
-
20
-
21
-
22
-
 23
23 -
 24
24 -
 25
25 -
 26
26 -
 27
27 -
 28
28 -
 29
29 -
 30
30 -
 31
31 -
 32
32 -
 33
33 -
 34
34 -
 35
35 -
 36
36 -
 37
37 -
 38
38 -
 39
39 -
 40
40 -
 41
41 -
 42
42 -
 43
43 -
44
-
45
-
46
-
47
-
48
-
49
-
50
-
51
-
52
-
53
-
54
-
55
-
56
-
57
-
58
-
59
-
60
-
61
-
62
-
63
-
64
-
65
-
66
-
67
-
68
-
69
-
70
-
71
-
72
-
73
-
74
-
75
-
76
-
77
-
78
-
79
-
80
-
81
-
82
-
83
-
84
-
85
-
86
-
87
-
88
-
89
-
90
-
91
-
92
-
93
-
94
-
95
-
96
-
97
-
98
-
99
-
100
-
101
-
102
-
103
-
104
-
105
-
106
-
107
-
108
-
109
-
110
-
111
-
112
-
113
-
114
-
115
-
116
-
117
-
118
-
119
-
120
-
121
-
122
-
123
-
124
-
125
-
126
-
127
-
128
-
129
-
130
-
131
-
132
-
133
-
134
-
135
-
136
-
137
-
138
-
139
-
140
-
141
-
142
-
143
-
144
-
145
-
146
-
147
-
148
-
149
-
150
-
151
-
152
-
153
-
154
-
155
-
156
-
157
-
158
-
159
-
160
-
161
-
162
-
163
-
164
-
165
-
166
-
167
-
168
-
169
-
170
 |
 |

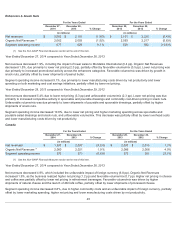
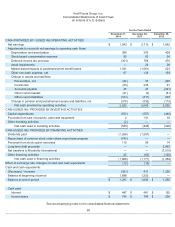
Net Cash Provided by Operating Activities:
Operating activities provided net cash of $2.0 billion in 2014, $2.0 billion in 2013, and $3.0 billion in 2012. Net earnings in 2014
included significant unfavorable non-cash market-based impacts to postemployment benefit plans and the related deferred tax
effects. Operating cash flows in 2014 also reflected lower pension contributions. Net earnings in 2013 included significant favorable
non-cash market-based impacts and the related deferred tax effects. Operating cash flows in 2013 also reflected pension
contributions of $611 million and working capital improvements.
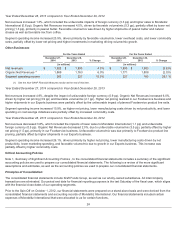
Net Cash Used in Investing Activities:
Net cash used in investing activities was $535 million in 2014, $426 million in 2013, and $422 million in 2012, comprised mainly of
capital expenditures. Our cash used in investing activities in 2013 also included the receipt of proceeds of $101 million from the
sale-leaseback of our headquarters facilities. We expect 2015 capital expenditures to be approximately $550 million to $600 million,
including capital expenditures required for our ongoing cost savings initiatives. We expect to fund these expenditures with cash
from operations.
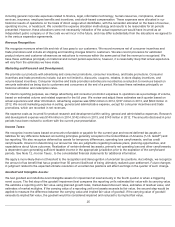
Net Cash Used in Financing Activities:
Net cash used in financing activities was $1.9 billion in 2014, $1.2 billion in 2013, and $1.4 billion in 2012. Net cash used in 2014
and 2013 was comprised mainly of dividend payments. In addition, in 2014 we spent $740 million to repurchase shares of our
common stock under our share repurchase program, which was authorized by our Board of Directors in December 2013. The net
cash used in 2012 primarily related to $7.2 billion of net transfers to MondelƝz International partially offset by the net proceeds we
received from our $6.0 billion debt issuance.
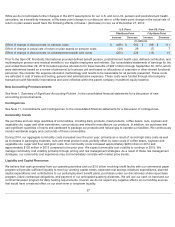
Total Debt:
Our total debt was $10.0 billion at December 27, 2014 and December 28, 2013. The weighted average remaining term of our debt
was 12.2 years at December 27, 2014. We have $1.4 billion of long-term debt maturing in the next 12 months that is classified as
current. Our long-term debt contains customary representations, covenants, and events of default. We were in compliance with all
covenants at December 27, 2014. We believe that cash on hand, cash flows from operations, and available short- and long-term
debt financing will be adequate to meet our contractual obligations.
On May 29, 2014, we entered into a new $3.0 billion five-year senior unsecured revolving credit facility that expires on May 29,
2019 unless extended. The credit facility enables us to borrow up to $3.0 billion, which may be increased by up to $1.0 billion in the
aggregate with the agreement of the lenders providing any increased commitments. All committed borrowings under the facility
bear interest at a variable annual rate based on the London Inter-Bank Offered Rate or a defined base rate, at our election, plus an
applicable margin based on the ratings of our long-term senior unsecured indebtedness. The credit facility requires us to maintain a
minimum total shareholders’ equity (excluding accumulated other comprehensive income or losses and any income or losses
recognized in connection with “mark-to-market” accounting in respect of pension and other retirement plans) of at least $2.4 billion
and also contains customary representations, covenants, and events of default. At December 27, 2014 and for the year ended
December 27, 2014, no amounts were drawn on this credit facility. The credit facility replaced our $3.0 billion five-year credit
agreement dated as of May 18, 2012. We expect to use the credit facility for general corporate purposes, including for working
capital purposes and to support our commercial paper issuances.
Off-Balance Sheet Arrangements and Aggregate Contractual Obligations
We have no material off-balance sheet arrangements other than the guarantees and contractual obligations that are discussed
below.
As discussed in Note 11, Commitments and Contingencies , to the consolidated financial statements, we have third-party
guarantees primarily covering long-term obligations related to leased properties. The carrying amount of our third-party guarantees
was $22 million at December 27, 2014 and $24 million at December 28, 2013. The maximum potential payment under these
guarantees was $42 million at December 27, 2014 and $53 million at December 28, 2013. Substantially all of these guarantees
expire at various times through 2027.
In addition, we were contingently liable for guarantees related to our own performance totaling $87 million at December 27, 2014
and $86 million at December 28, 2013. These primarily include letters of credit related to dairy commodity purchases and other
letters of credit.
28