Kraft 2014 Annual Report Download - page 29
Download and view the complete annual report
Please find page 29 of the 2014 Kraft annual report below. You can navigate through the pages in the report by either clicking on the pages listed below, or by using the keyword search tool below to find specific information within the annual report.-
 1
1 -
2
-
3
-
4
-
5
-
6
-
7
-
8
-
9
-
10
-
11
-
12
-
13
-
14
-
15
-
16
-
17
-
18
-
 19
19 -
 20
20 -
 21
21 -
 22
22 -
 23
23 -
 24
24 -
 25
25 -
 26
26 -
 27
27 -
 28
28 -
 29
29 -
 30
30 -
 31
31 -
 32
32 -
 33
33 -
 34
34 -
 35
35 -
 36
36 -
 37
37 -
 38
38 -
 39
39 -
40
-
41
-
42
-
43
-
44
-
45
-
46
-
47
-
48
-
49
-
50
-
51
-
52
-
53
-
54
-
55
-
56
-
57
-
58
-
59
-
60
-
61
-
62
-
63
-
64
-
65
-
66
-
67
-
68
-
69
-
70
-
71
-
72
-
73
-
74
-
75
-
76
-
77
-
78
-
79
-
80
-
81
-
82
-
83
-
84
-
85
-
86
-
87
-
88
-
89
-
90
-
91
-
92
-
93
-
94
-
95
-
96
-
97
-
98
-
99
-
100
-
101
-
102
-
103
-
104
-
105
-
106
-
107
-
108
-
109
-
110
-
111
-
112
-
113
-
114
-
115
-
116
-
117
-
118
-
119
-
120
-
121
-
122
-
123
-
124
-
125
-
126
-
127
-
128
-
129
-
130
-
131
-
132
-
133
-
134
-
135
-
136
-
137
-
138
-
139
-
140
-
141
-
142
-
143
-
144
-
145
-
146
-
147
-
148
-
149
-
150
-
151
-
152
-
153
-
154
-
155
-
156
-
157
-
158
-
159
-
160
-
161
-
162
-
163
-
164
-
165
-
166
-
167
-
168
-
169
-
170
 |
 |

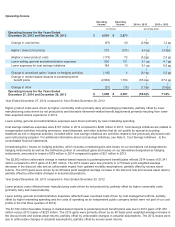
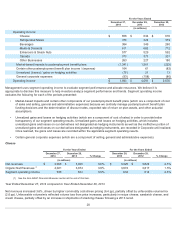
Year Ended December 28, 2013 compared to Year Ended December 29, 2012
Net revenues increased 1.3%, which included the unfavorable impacts of foreign currency (3.3 pp) and higher sales to MondelƝz
International (0.6 pp). Organic Net Revenues increased 4.0%, driven by favorable volume/mix (5.3 pp), partially offset by lower net
pricing (1.3 pp), primarily in peanut butter. Favorable volume/mix was driven by higher shipments of peanut butter and natural
cheese as well as favorable mix from coffee.
Segment operating income increased 23.9%, driven primarily by favorable volume/mix, lower overhead costs, and lower commodity
costs, partially offset by lower net pricing and higher investments in marketing driving volume/mix growth.
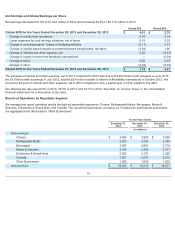
Other Businesses
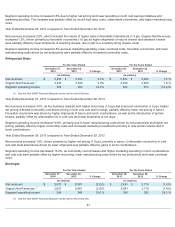
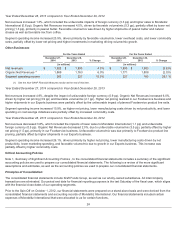
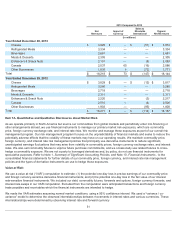
Year Ended December 27, 2014 compared to Year Ended December 28, 2013
Net revenues increased 4.9%, despite the impact of unfavorable foreign currency (0.9 pp). Organic Net Revenues increased 6.0%,
driven by higher net pricing (3.9 pp) and favorable volume/mix (2.1 pp). Higher net pricing realized in our Foodservice business and
higher shipments in our Exports business were partially offset by the unfavorable impact of planned Foodservice product line exits.
Segment operating income increased 15.9%, as higher net pricing, lower manufacturing costs driven by net productivity, and lower
spending on cost savings initiatives were partially offset by increased commodity costs.
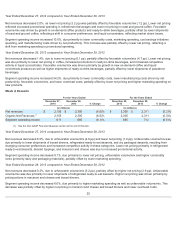
Year Ended December 28, 2013 compared to Year Ended December 29, 2012
Net revenues decreased 3.6%, which included the impacts of lower sales to MondelƝz International (1.1 pp) and unfavorable
foreign currency (0.5 pp). Organic Net Revenues decreased 2.0%, due to unfavorable volume/mix (3.5 pp), partially offset by higher
net pricing (1.5 pp), primarily in our Foodservice business. Unfavorable volume/mix was due primarily to Foodservice product line
pruning, partially offset by higher shipments in our Exports business.
Segment operating income increased 26.1%, driven primarily by higher net pricing, lower manufacturing costs driven by net
productivity, lower marketing spending, and favorable volume/mix due to growth in our Exports business. This increase was
partially offset by higher commodity costs.
Critical Accounting Policies
Note 1, Summary of Significant Accounting Policies , to the consolidated financial statements includes a summary of the significant
accounting policies we used to prepare our consolidated financial statements. The following is a review of the more significant
assumptions and estimates, as well as the accounting policies we used to prepare our consolidated financial statements.
Principles of Consolidation:
The consolidated financial statements include Kraft Foods Group, as well as our wholly-owned subsidiaries. All intercompany
transactions are eliminated. Our period end date for financial reporting purposes is the last Saturday of the fiscal year, which aligns
with the financial close dates of our operating segments.
Prior to the Spin-Off on October 1, 2012, our financial statements were prepared on a stand-alone basis and were derived from the
consolidated financial statements and accounting records of MondelƝz International. Our financial statements included certain
expenses of MondelƝz International that were allocated to us for certain functions,
24
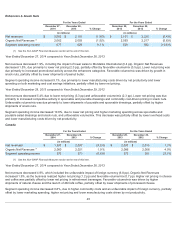
For the Years Ended For the Years Ended
December 27,
2014
December 28,
2013 % Change
December 28,
2013
December 29,
2012 % Change
(in millions) (in millions)
Net revenues $ 1,925 $ 1,835 4.9 % $1,835 $ 1,903 (3.6 )%
Organic Net Revenues
(1)
1,869 1,763 6.0 % 1,771 1,808 (2.0 )%
Segment operating income 263 227 15.9 % 227 180 26.1 %
(1) See the Non-GAAP Financial Measures section at the end of this item.