Kraft 2014 Annual Report Download - page 27
Download and view the complete annual report
Please find page 27 of the 2014 Kraft annual report below. You can navigate through the pages in the report by either clicking on the pages listed below, or by using the keyword search tool below to find specific information within the annual report.-
 1
1 -
2
-
3
-
4
-
5
-
6
-
7
-
8
-
9
-
10
-
11
-
12
-
13
-
14
-
15
-
16
-
 17
17 -
 18
18 -
 19
19 -
 20
20 -
 21
21 -
 22
22 -
 23
23 -
 24
24 -
 25
25 -
 26
26 -
 27
27 -
 28
28 -
 29
29 -
 30
30 -
 31
31 -
 32
32 -
 33
33 -
 34
34 -
 35
35 -
 36
36 -
 37
37 -
38
-
39
-
40
-
41
-
42
-
43
-
44
-
45
-
46
-
47
-
48
-
49
-
50
-
51
-
52
-
53
-
54
-
55
-
56
-
57
-
58
-
59
-
60
-
61
-
62
-
63
-
64
-
65
-
66
-
67
-
68
-
69
-
70
-
71
-
72
-
73
-
74
-
75
-
76
-
77
-
78
-
79
-
80
-
81
-
82
-
83
-
84
-
85
-
86
-
87
-
88
-
89
-
90
-
91
-
92
-
93
-
94
-
95
-
96
-
97
-
98
-
99
-
100
-
101
-
102
-
103
-
104
-
105
-
106
-
107
-
108
-
109
-
110
-
111
-
112
-
113
-
114
-
115
-
116
-
117
-
118
-
119
-
120
-
121
-
122
-
123
-
124
-
125
-
126
-
127
-
128
-
129
-
130
-
131
-
132
-
133
-
134
-
135
-
136
-
137
-
138
-
139
-
140
-
141
-
142
-
143
-
144
-
145
-
146
-
147
-
148
-
149
-
150
-
151
-
152
-
153
-
154
-
155
-
156
-
157
-
158
-
159
-
160
-
161
-
162
-
163
-
164
-
165
-
166
-
167
-
168
-
169
-
170
 |
 |

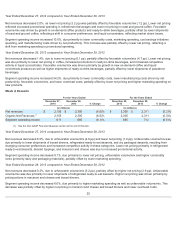
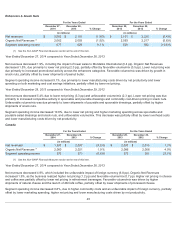
Year Ended December 27, 2014 compared to Year Ended December 28, 2013
Net revenues decreased 2.0%, as lower net pricing (3.2 pp) was partially offset by favorable volume/mix (1.2 pp). Lower net pricing
reflected increased promotional spending in refreshment beverages and lower net pricing in roast and ground coffee. Favorable
volume/mix was driven by growth in on-demand coffee products and ready-to-drink beverages, partially offset by lower shipments
of roast and ground coffee, reflecting a shift in consumer preferences, and liquid concentrates, reflecting market share losses.
Segment operating income increased 10.0%, due primarily to lower commodity costs, marketing spending, cost savings initiatives
spending, and manufacturing costs driven by net productivity. This increase was partially offset by lower net pricing, reflecting a
shift from marketing spending to promotional spending.
Year Ended December 28, 2013 compared to Year Ended December 29, 2012
Net revenues decreased 1.4%, due to lower net pricing (6.1 pp), partially offset by favorable volume/mix (4.7 pp). Lower net pricing
was due primarily to lower net pricing in coffee, increased promotions in ready-to-drink beverages, and increased competitive
activity in liquid concentrates. Favorable volume/mix was driven primarily by growth in new on-demand coffee and liquid
concentrate products as well as higher shipments of ready-to-drink beverages, partially offset by lower shipments of powdered
beverages.
Segment operating income increased 34.2%, due primarily to lower commodity costs, lower manufacturing costs driven by net
productivity, favorable volume/mix, and lower overhead costs, partially offset by lower net pricing and higher marketing spending on
new products.
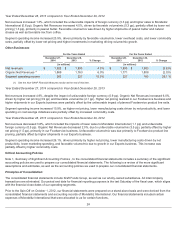
Meals & Desserts
Year Ended December 27, 2014 compared to Year Ended December 28, 2013
Net revenues decreased 6.5%, due to unfavorable volume/mix (4.6 pp) and lower net pricing (1.9 pp). Unfavorable volume/mix was
due primarily to lower shipments of boxed dinners, refrigerated ready-to-eat desserts, and dry packaged desserts, resulting from
changing consumer preferences and increased competitive activity in these categories. Lower net pricing primarily in refrigerated
ready-to-eat desserts, dessert toppings, and macaroni and cheese was due to increased promotional activity.
Segment operating income decreased 8.1%, due primarily to lower net pricing, unfavorable volume/mix and higher commodity
costs (primarily dairy and packaging materials), partially offset by lower marketing spending.
Year Ended December 28, 2013 compared to Year Ended December 29, 2012
Net revenues decreased 0.3%, due to unfavorable volume/mix (3.2 pp), partially offset by higher net pricing (2.9 pp). Unfavorable
volume/mix was due primarily to lower shipments of refrigerated ready-to-eat desserts. Higher net pricing was driven primarily by
pricing actions in macaroni and cheese and boxed dinners.
Segment operating income decreased 6.6%, due primarily to higher marketing spending as well as unfavorable volume/mix. This
decrease was partially offset by higher net pricing in macaroni and cheese and boxed dinners and lower overhead costs.
22
For the Years Ended For the Years Ended
December 27,
2014
December 28,
2013 % Change
December 28,
2013
December 29,
2012 % Change
(in millions) (in millions)
Net revenues $2,155 $ 2,305 (6.5 )% $2,305 $2,311 (0.3 )%
Organic Net Revenues
(1)
2,155 2,305 (6.5 )% 2,305 2,311 (0.3 )%
Segment operating income 611 665 (8.1 )% 665 712 (6.6 )%
(1) See the Non-GAAP Financial Measures section at the end of this item.