Kraft 2014 Annual Report Download - page 57
Download and view the complete annual report
Please find page 57 of the 2014 Kraft annual report below. You can navigate through the pages in the report by either clicking on the pages listed below, or by using the keyword search tool below to find specific information within the annual report.-
 1
1 -
2
-
3
-
4
-
5
-
6
-
7
-
8
-
9
-
10
-
11
-
12
-
13
-
14
-
15
-
16
-
17
-
18
-
19
-
20
-
21
-
22
-
23
-
24
-
25
-
26
-
27
-
28
-
29
-
30
-
31
-
32
-
33
-
34
-
35
-
36
-
37
-
38
-
39
-
40
-
41
-
42
-
43
-
44
-
45
-
46
-
 47
47 -
 48
48 -
 49
49 -
 50
50 -
 51
51 -
 52
52 -
 53
53 -
 54
54 -
 55
55 -
 56
56 -
 57
57 -
 58
58 -
 59
59 -
 60
60 -
 61
61 -
 62
62 -
 63
63 -
 64
64 -
 65
65 -
 66
66 -
 67
67 -
68
-
69
-
70
-
71
-
72
-
73
-
74
-
75
-
76
-
77
-
78
-
79
-
80
-
81
-
82
-
83
-
84
-
85
-
86
-
87
-
88
-
89
-
90
-
91
-
92
-
93
-
94
-
95
-
96
-
97
-
98
-
99
-
100
-
101
-
102
-
103
-
104
-
105
-
106
-
107
-
108
-
109
-
110
-
111
-
112
-
113
-
114
-
115
-
116
-
117
-
118
-
119
-
120
-
121
-
122
-
123
-
124
-
125
-
126
-
127
-
128
-
129
-
130
-
131
-
132
-
133
-
134
-
135
-
136
-
137
-
138
-
139
-
140
-
141
-
142
-
143
-
144
-
145
-
146
-
147
-
148
-
149
-
150
-
151
-
152
-
153
-
154
-
155
-
156
-
157
-
158
-
159
-
160
-
161
-
162
-
163
-
164
-
165
-
166
-
167
-
168
-
169
-
170
 |
 |
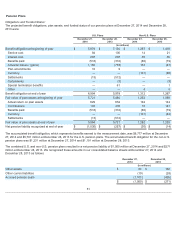
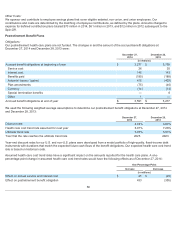
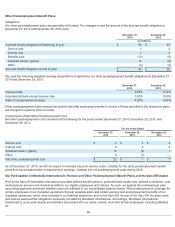
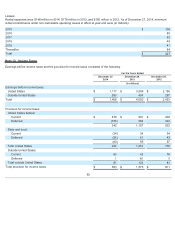
Certain of our U.S. and non-U.S. plans are underfunded based on accumulated benefit obligations in excess of plan assets. For
these plans, the projected benefit obligations, accumulated benefit obligations, and the fair value of plan assets at December 27,
2014 and December 28, 2013 were:
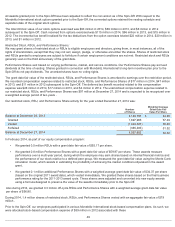
We used the following weighted average assumptions to determine our benefit obligations under the pension plans at December
27, 2014 and December 28, 2013:
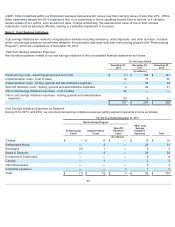
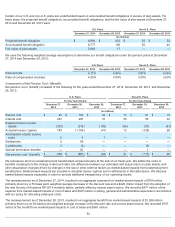
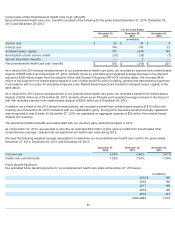
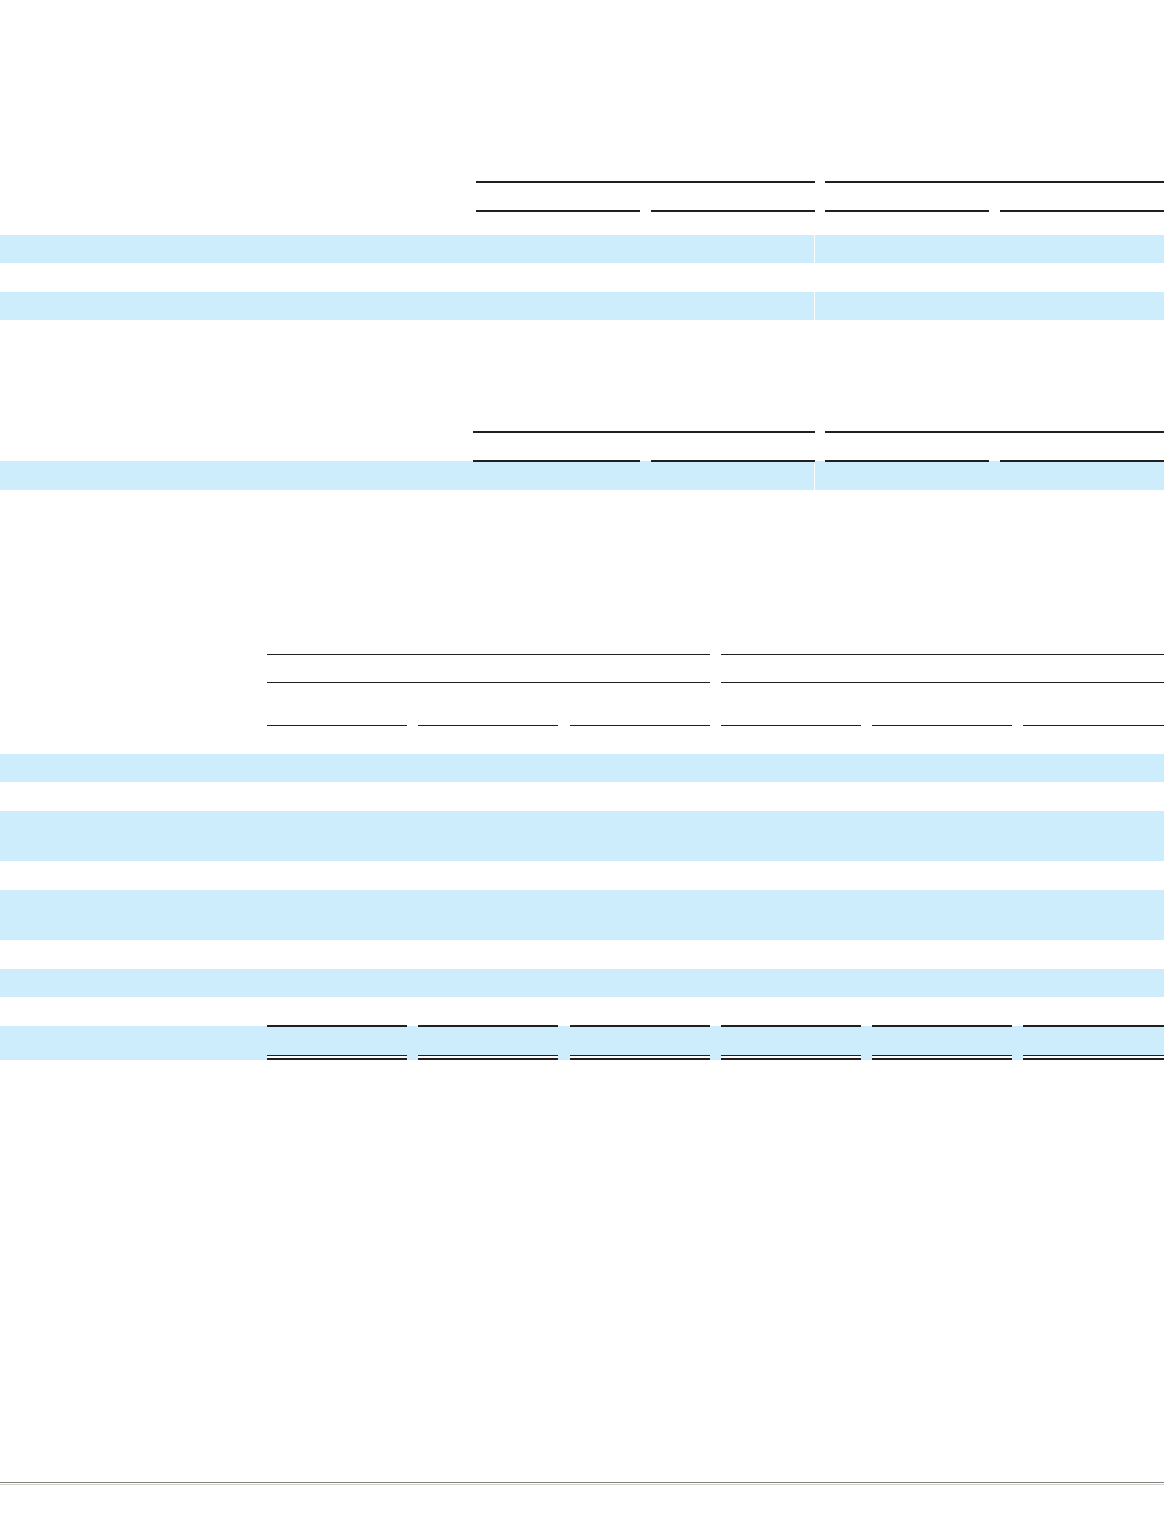
Components of Net Pension Cost / (Benefit):
Net pension cost / (benefit) consisted of the following for the years ended December 27, 2014, December 28, 2013, and December
29, 2012:
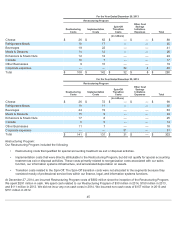
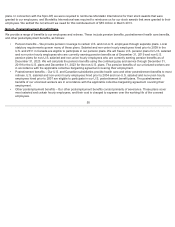
We remeasure all of our postemployment benefit plans at least annually at the end of our fiscal year. We define the costs or
benefits resulting from the change in discount rates, the difference between our estimated and actual return on plan assets, and
other assumption changes driven by changes in the law or other external factors as market-based impacts from postemployment
benefit plans. Market-based impacts are included in actuarial losses / (gains) and in settlements in the table above. We disclose
market-based impacts separately in order to provide additional transparency of our operating results.
The remeasurement as of December 27, 2014, resulted in an aggregate expense from market-based impacts of $784 million
primarily driven by a 75 basis point weighted average decrease in the discount rate and a $429 million impact from the adoption of
the new Society of Actuaries RP-2014 mortality tables, partially offset by excess asset returns. We recorded $477 million of the
expense from market-based impacts in cost of sales and $307 million in selling, general and administrative expenses in accordance
with our policy for allocating employee costs.
The remeasurement as of December 28, 2013, resulted in an aggregate benefit from market-based impacts of $1,268 million
primarily driven by an 80 basis point weighted average increase in the discount rate and excess asset returns. We recorded $707
million of the benefit from market-based impacts in cost of sales and $561 million
52
U.S. Plans Non-U.S. Plans
December 27, 2014 December 28, 2013 December 27, 2014 December 28, 2013
(in millions)
Projected benefit obligation $6,994 $203 $55 $52
Accumulated benefit obligation 6,777 186 50 44
Fair value of plan assets 5,964 17 — —
U.S. Plans Non-U.S. Plans
December 27, 2014 December 28, 2013 December 27, 2014 December 28, 2013
Discount rate 4.17 % 4.94 % 3.87% 4.56 %
Rate of compensation increase 4.00 % 4.00 % 3.00% 3.00 %
U.S. Plans Non-U.S. Plans
For the Years Ended For the Years Ended
December 27,
2014
December 28,
2013
December 29,
2012
December 27,
2014
December 28,
2013
December 29,
2012
(in millions)
Service cost $84 $100 $ 32 $14 $21 $12
Interest cost 287 287 70 55 55 32
Expected return on plan
assets (325 ) (315 ) (105 ) (60 ) (57 ) (43 )
Actuarial losses / (gains) 783 (1,154 ) (41 ) 12 (128 ) 28
Amortization of prior service
costs 5 4 1 — — —
Settlements 2
69 — — — —
Curtailments 3 (3 ) — — (9 ) —
Special termination benefits — 61 — — 1 —
Net pension cost / (benefit) $839 $(951 ) $ (43) $21 $(117 ) $29