Kraft 2014 Annual Report Download - page 28
Download and view the complete annual report
Please find page 28 of the 2014 Kraft annual report below. You can navigate through the pages in the report by either clicking on the pages listed below, or by using the keyword search tool below to find specific information within the annual report.-
 1
1 -
2
-
3
-
4
-
5
-
6
-
7
-
8
-
9
-
10
-
11
-
12
-
13
-
14
-
15
-
16
-
17
-
 18
18 -
 19
19 -
 20
20 -
 21
21 -
 22
22 -
 23
23 -
 24
24 -
 25
25 -
 26
26 -
 27
27 -
 28
28 -
 29
29 -
 30
30 -
 31
31 -
 32
32 -
 33
33 -
 34
34 -
 35
35 -
 36
36 -
 37
37 -
 38
38 -
39
-
40
-
41
-
42
-
43
-
44
-
45
-
46
-
47
-
48
-
49
-
50
-
51
-
52
-
53
-
54
-
55
-
56
-
57
-
58
-
59
-
60
-
61
-
62
-
63
-
64
-
65
-
66
-
67
-
68
-
69
-
70
-
71
-
72
-
73
-
74
-
75
-
76
-
77
-
78
-
79
-
80
-
81
-
82
-
83
-
84
-
85
-
86
-
87
-
88
-
89
-
90
-
91
-
92
-
93
-
94
-
95
-
96
-
97
-
98
-
99
-
100
-
101
-
102
-
103
-
104
-
105
-
106
-
107
-
108
-
109
-
110
-
111
-
112
-
113
-
114
-
115
-
116
-
117
-
118
-
119
-
120
-
121
-
122
-
123
-
124
-
125
-
126
-
127
-
128
-
129
-
130
-
131
-
132
-
133
-
134
-
135
-
136
-
137
-
138
-
139
-
140
-
141
-
142
-
143
-
144
-
145
-
146
-
147
-
148
-
149
-
150
-
151
-
152
-
153
-
154
-
155
-
156
-
157
-
158
-
159
-
160
-
161
-
162
-
163
-
164
-
165
-
166
-
167
-
168
-
169
-
170
 |
 |

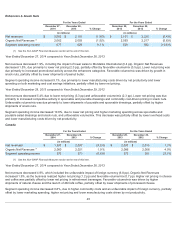
Enhancers & Snack Nuts
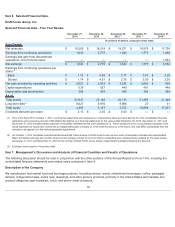
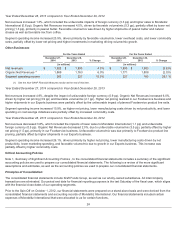
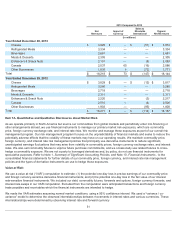
Year Ended December 27, 2014 compared to Year Ended December 28, 2013
Net revenues decreased 1.9%, including the impact of lower sales to MondelƝz International (0.4 pp). Organic Net Revenues
decreased 1.5%, due primarily to lower net pricing (2.0 pp), partially offset by favorable volume/mix (0.5 pp). Lower net pricing was
due primarily to increased promotional activity across the enhancers categories. Favorable volume/mix was driven by growth in
snack nuts, partially offset by lower shipments of peanut butter.
Segment operating income increased 9.1%, due primarily to lower manufacturing costs driven by net productivity and lower
spending on both marketing and cost savings initiatives, partially offset by lower net pricing.
Year Ended December 28, 2013 compared to Year Ended December 29, 2012
Net revenues decreased 5.4% due to lower net pricing (3.3 pp) and unfavorable volume/mix (2.3 pp). Lower net pricing was due
primarily to increased competitive activity in spoonable and pourable dressings and commodity cost-driven pricing in snack nuts.
Unfavorable volume/mix was due primarily to lower shipments of pourable and spoonable dressings, partially offset by higher
shipments of snack nuts.
Segment operating income decreased 10.6%, due to lower net pricing and higher marketing spending across spoonable and
pourable salad dressings and snack nuts, and unfavorable volume/mix. This decrease was partially offset by lower overhead costs
and lower manufacturing costs driven by net productivity.
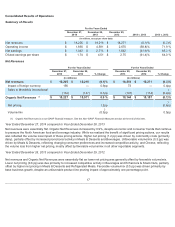
Canada
Year Ended December 27, 2014 compared to Year Ended December 28, 2013
Net revenues decreased 4.9%, which included the unfavorable impact of foreign currency (6.8 pp). Organic Net Revenues
increased 1.9%, as the business realized higher net pricing (1.2 pp) and favorable volume/mix (0.7 pp). Higher net pricing in cheese
and coffee was partially offset by lower net pricing in refreshment beverages. Favorable volume/mix was driven by higher
shipments of natural cheese and the launch of McCafé coffee, partially offset by lower shipments of processed cheese.
Segment operating income decreased 0.8%, due to higher commodity costs and an unfavorable impact of foreign currency, partially
offset by lower marketing spending, higher net pricing and lower manufacturing costs driven by net productivity.
23
For the Years Ended For the Years Ended
December 27,
2014
December 28,
2013 % Change
December 28,
2013
December 29,
2012 % Change
(in millions) (in millions)
Net revenues $2,062 $ 2,101 (1.9 )% $2,101 $2,220 (5.4 )%
Organic Net Revenues
(1)
2,062 2,093 (1.5 )% 2,093 2,217 (5.6 )%
Segment operating income 577 529 9.1 % 529 592 (10.6 )%
(1) See the Non-GAAP Financial Measures section at the end of this item.
For the Years Ended For the Years Ended
December 27,
2014 December 28,
2013 % Change December 28,
2013 December 29,
2012 % Change
(in millions) (in millions)
Net revenues $ 1,937 $ 2,037 (4.9 )% $ 2,037 $ 2,010 1.3 %
Organic Net Revenues
(1)
2,060 2,021 1.9 % 2,086 2,006 4.0 %
Segment operating income 370 373 (0.8 )% 373 301 23.9 %
(1) See the Non-GAAP Financial Measures section at the end of this item.