IHOP 2008 Annual Report Download - page 87
Download and view the complete annual report
Please find page 87 of the 2008 IHOP annual report below. You can navigate through the pages in the report by either clicking on the pages listed below, or by using the keyword search tool below to find specific information within the annual report.-
 1
1 -
2
-
3
-
4
-
5
-
6
-
7
-
8
-
9
-
10
-
11
-
12
-
13
-
14
-
15
-
16
-
17
-
18
-
19
-
20
-
21
-
22
-
23
-
24
-
25
-
26
-
27
-
28
-
29
-
30
-
31
-
32
-
33
-
34
-
35
-
36
-
37
-
38
-
39
-
40
-
41
-
42
-
43
-
44
-
45
-
46
-
47
-
48
-
49
-
50
-
51
-
52
-
53
-
54
-
55
-
56
-
57
-
58
-
59
-
60
-
61
-
62
-
63
-
64
-
65
-
66
-
67
-
68
-
69
-
70
-
71
-
72
-
73
-
74
-
75
-
76
-
 77
77 -
 78
78 -
 79
79 -
 80
80 -
 81
81 -
 82
82 -
 83
83 -
 84
84 -
 85
85 -
 86
86 -
 87
87 -
 88
88 -
 89
89 -
 90
90 -
 91
91 -
 92
92 -
 93
93 -
 94
94 -
 95
95 -
 96
96 -
 97
97 -
98
-
99
-
100
-
101
-
102
-
103
-
104
-
105
-
106
-
107
-
108
-
109
-
110
-
111
-
112
-
113
-
114
-
115
-
116
-
117
-
118
-
119
-
120
-
121
-
122
-
123
-
124
-
125
-
126
-
127
-
128
-
129
-
130
-
131
-
132
-
133
-
134
-
135
-
136
-
137
-
138
-
139
-
140
-
141
-
142
-
143
-
144
-
145
-
146
-
147
-
148
-
149
-
150
-
151
-
152
-
153
-
154
-
155
-
156
-
157
-
158
-
159
-
160
-
161
-
162
 |
 |

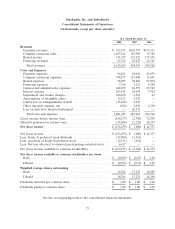
DineEquity, Inc. and Subsidiaries
Consolidated Statements of Operations
(In thousands, except per share amounts)
Year Ended December 31,
2008 2007 2006
Revenues
Franchise revenues .................................. $ 353,331 $205,757 $179,331
Company restaurant sales ............................. 1,103,228 125,905 13,585
Rental income ...................................... 131,347 132,422 132,101
Financing revenues .................................. 25,722 20,475 24,543
Total revenues .................................... 1,613,628 484,559 349,560
Costs and Expenses
Franchise expenses .................................. 96,243 88,054 83,079
Company restaurant expenses ........................... 978,197 117,448 15,601
Rental expenses .................................... 98,057 98,402 97,904
Financing expenses .................................. 7,314 1,215 4,240
General and administrative expenses ..................... 182,239 81,597 63,543
Interest expense .................................... 203,141 28,654 7,902
Impairment and closure charges ......................... 240,630 4,381 43
Amortization of intangible assets ........................ 12,132 1,132 —
(Gain) loss on extinguishment of debt .................... (15,242) 2,223 —
Other (income) expense, net ........................... (926) 2,030 4,398
Loss on derivative financial instrument .................... — 62,131 —
Total costs and expenses ............................. 1,801,785 487,267 276,710
(Loss) income before income taxes ........................ (188,157) (2,708) 72,850
(Benefit) provision for income taxes ....................... (33,698) (2,228) 28,297
Net (loss) income ..................................... $(154,459) $ (480) $ 44,553
Net (loss) income ..................................... $(154,459) $ (480) $ 44,553
Less: Series A preferred stock dividends .................... (19,000) (1,561) —
Less: Accretion of Series B preferred stock .................. (2,151) (181) —
Less: Net loss allocated to unvested participating restricted stock . . 6,417 — —
Net (loss) income available to common stockholders ............ $(169,193) $ (2,222) $ 44,553
Net (loss) income available to common stockholders per share
Basic ............................................ $ (10.09) $ (0.13) $ 2.46
Diluted ........................................... $ (10.09) $ (0.13) $ 2.43
Weighted average shares outstanding
Basic ............................................ 16,764 17,232 18,085
Diluted ........................................... 16,764 17,232 18,298
Dividends declared per common share ...................... $ 1.00 $ 1.00 $ 1.00
Dividends paid per common share ......................... $ 1.00 $ 1.00 $ 1.00
See the accompanying notes to the consolidated financial statements.
73