IHOP 2008 Annual Report Download - page 56
Download and view the complete annual report
Please find page 56 of the 2008 IHOP annual report below. You can navigate through the pages in the report by either clicking on the pages listed below, or by using the keyword search tool below to find specific information within the annual report.-
 1
1 -
2
-
3
-
4
-
5
-
6
-
7
-
8
-
9
-
10
-
11
-
12
-
13
-
14
-
15
-
16
-
17
-
18
-
19
-
20
-
21
-
22
-
23
-
24
-
25
-
26
-
27
-
28
-
29
-
30
-
31
-
32
-
33
-
34
-
35
-
36
-
37
-
38
-
39
-
40
-
41
-
42
-
43
-
44
-
45
-
 46
46 -
 47
47 -
 48
48 -
 49
49 -
 50
50 -
 51
51 -
 52
52 -
 53
53 -
 54
54 -
 55
55 -
 56
56 -
 57
57 -
 58
58 -
 59
59 -
 60
60 -
 61
61 -
 62
62 -
 63
63 -
 64
64 -
 65
65 -
 66
66 -
67
-
68
-
69
-
70
-
71
-
72
-
73
-
74
-
75
-
76
-
77
-
78
-
79
-
80
-
81
-
82
-
83
-
84
-
85
-
86
-
87
-
88
-
89
-
90
-
91
-
92
-
93
-
94
-
95
-
96
-
97
-
98
-
99
-
100
-
101
-
102
-
103
-
104
-
105
-
106
-
107
-
108
-
109
-
110
-
111
-
112
-
113
-
114
-
115
-
116
-
117
-
118
-
119
-
120
-
121
-
122
-
123
-
124
-
125
-
126
-
127
-
128
-
129
-
130
-
131
-
132
-
133
-
134
-
135
-
136
-
137
-
138
-
139
-
140
-
141
-
142
-
143
-
144
-
145
-
146
-
147
-
148
-
149
-
150
-
151
-
152
-
153
-
154
-
155
-
156
-
157
-
158
-
159
-
160
-
161
-
162
 |
 |

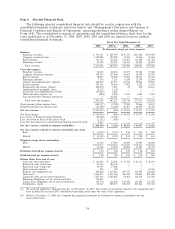
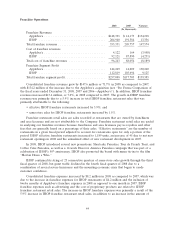
(c) ‘‘Sales percentage change’’ reflects, for each category of restaurants, the percentage change in sales
in any given fiscal year compared to the prior fiscal year for all restaurants in that category.
(d) ‘‘Same-store sales percentage change’’ reflects the percentage change in sales, in any given fiscal
year compared to the prior fiscal year, for restaurants that have been operated throughout both
fiscal periods that are being compared and have been open for at least 18 months. Because of new
unit openings and store closures, the restaurants open throughout both fiscal periods being
compared will be different from period to period. Same-store sales percentage change does not
include data on IHOP restaurants located in Florida.
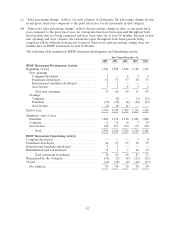
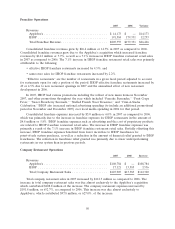
The following table summarizes IHOP restaurant development and franchising activity:
Year Ended December 31,
2008 2007 2006 2005 2004
IHOP Restaurant Development Activity
Beginning of year ........................... 1,344 1,302 1,242 1,186 1,165
New openings
Company-developed ...................... 1 —446
Franchisee-developed ..................... 62 57 57 58 35
International franchisee-developed ............ 3 2———
Area license ............................51856
Total new openings ..................... 71 60 69 67 47
Closings
Company .............................. — (2) — (1) (11)
Franchise .............................. (17) (12) (8) (10) (15)
Area license ............................ (2) (4) (1) — —
End of year ................................ 1,396 1,344 1,302 1,242 1,186
Summary—end of year
Franchise ................................ 1,225 1,176 1,132 1,082 1,028
Company ................................ 11 11 10 7 10
Area license .............................. 160 157 160 153 148
Total ................................ 1,396 1,344 1,302 1,242 1,186
IHOP Restaurant Franchising Activity
Company-developed ..........................——— 3 8
Franchisee-developed ......................... 62 57 57 58 35
International franchisee-developed ............... 3 2———
Rehabilitated and refranchised .................. 13 4 9 26 33
Total restaurant franchised ................ 78 63 66 87 76
Reacquired by the Company .................... (13) (7) (8) (23) (12)
Closed ................................... (16) (12) (8) (10) (15)
Net addition .............................. 49 44 50 54 49
42