IHOP 2008 Annual Report Download - page 64
Download and view the complete annual report
Please find page 64 of the 2008 IHOP annual report below. You can navigate through the pages in the report by either clicking on the pages listed below, or by using the keyword search tool below to find specific information within the annual report.-
 1
1 -
2
-
3
-
4
-
5
-
6
-
7
-
8
-
9
-
10
-
11
-
12
-
13
-
14
-
15
-
16
-
17
-
18
-
19
-
20
-
21
-
22
-
23
-
24
-
25
-
26
-
27
-
28
-
29
-
30
-
31
-
32
-
33
-
34
-
35
-
36
-
37
-
38
-
39
-
40
-
41
-
42
-
43
-
44
-
45
-
46
-
47
-
48
-
49
-
50
-
51
-
52
-
53
-
 54
54 -
 55
55 -
 56
56 -
 57
57 -
 58
58 -
 59
59 -
 60
60 -
 61
61 -
 62
62 -
 63
63 -
 64
64 -
 65
65 -
 66
66 -
 67
67 -
 68
68 -
 69
69 -
 70
70 -
 71
71 -
 72
72 -
 73
73 -
 74
74 -
75
-
76
-
77
-
78
-
79
-
80
-
81
-
82
-
83
-
84
-
85
-
86
-
87
-
88
-
89
-
90
-
91
-
92
-
93
-
94
-
95
-
96
-
97
-
98
-
99
-
100
-
101
-
102
-
103
-
104
-
105
-
106
-
107
-
108
-
109
-
110
-
111
-
112
-
113
-
114
-
115
-
116
-
117
-
118
-
119
-
120
-
121
-
122
-
123
-
124
-
125
-
126
-
127
-
128
-
129
-
130
-
131
-
132
-
133
-
134
-
135
-
136
-
137
-
138
-
139
-
140
-
141
-
142
-
143
-
144
-
145
-
146
-
147
-
148
-
149
-
150
-
151
-
152
-
153
-
154
-
155
-
156
-
157
-
158
-
159
-
160
-
161
-
162
 |
 |

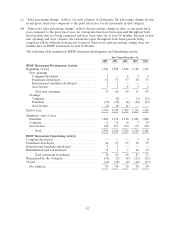
Franchise Operations
2007 2006 Variance
Revenues
Applebee’s .................................... $ 14,173 $ — $14,173
IHOP ....................................... 191,584 179,331 12,253
Total Franchise Revenue .......................... $205,757 $179,331 $26,426
Consolidated franchise revenues grew by $26.4 million or 14.7% in 2007 as compared to 2006.
Consolidated franchise revenues grew due to the Applebee’s acquisition which increased franchise
revenues by $14.2 million or 7.9%, as well as a 7.1% increase in IHOP franchise restaurant retail sales
in 2007 as compared to 2006. The 7.1% increase in IHOP franchise restaurant retail sales was primarily
attributable to the following:
• effective IHOP franchise restaurants increased by 4.5%; and
• same-store sales for IHOP franchise restaurants increased by 2.2%.
‘‘Effective restaurants’’ are the number of restaurants in a given fiscal period adjusted to account
for restaurants open for only a portion of the period. IHOP effective franchise restaurants increased by
49 or 4.5% due to new restaurant openings in 2007 and the annualized effect of new restaurant
development in 2006.
In 2007, IHOP had various promotions including the rollout of new menu items in November
2007, and other promotions throughout the year which included ‘‘Pancake Surrender,’’ ‘‘Fruit Crepe
Fever,’’ ‘‘Sweet Strawberry Serenade,’’ ‘‘Stuffed French Toast Treasures,’’ and ‘‘Cinn-A-Stacks
Celebration.’’ IHOP also increased national advertising spending (to include an additional promotional
period in November and December 2007) over local media spending in 2006 for that period.
Consolidated franchise expenses increased by $5.0 million or 6.0% in 2007 as compared to 2006,
which was primarily due to the increase in franchise expenses for IHOP restaurants in the amount of
$4.8 million or 5.8%. IHOP franchise expenses such as advertising and the cost of proprietary products
are related to IHOP franchise restaurant retail sales. The increase in IHOP franchise expenses was
primarily a result of the 7.1% increase in IHOP franchise restaurant retail sales. Partially offsetting this
increase, IHOP franchise expenses benefited from lower incentives to IHOP franchisees for
point-of-sale system purchases, as well as a reduction in the amount of financial relief granted to IHOP
franchisees. The reduction in franchisee relief granted was primarily due to fewer underperforming
restaurants in our system than in previous periods.
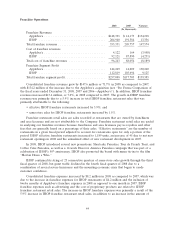
Company Restaurant Operations
2007 2006 Increase
Revenues
Applebee’s .................................... $108,784 $ — $108,784
IHOP ....................................... 17,121 13,585 3,536
Total Company Restaurant Sales .................... $125,905 $13,585 $112,320
Total company restaurant sales in 2007 increased by $112.3 million as compared to 2006. The
increase in total company restaurant sales was due almost exclusively to the Applebee’s acquisition
which contributed $108.8 million of the increase. The company restaurant expenses increased by
$101.8 million, or 652.7%, as compared to 2006. This increase was due almost exclusively to
Applebee’s, which contributed $97.8 million, or 627.0%, of the increase.
50