IHOP 2008 Annual Report Download - page 59
Download and view the complete annual report
Please find page 59 of the 2008 IHOP annual report below. You can navigate through the pages in the report by either clicking on the pages listed below, or by using the keyword search tool below to find specific information within the annual report.-
 1
1 -
2
-
3
-
4
-
5
-
6
-
7
-
8
-
9
-
10
-
11
-
12
-
13
-
14
-
15
-
16
-
17
-
18
-
19
-
20
-
21
-
22
-
23
-
24
-
25
-
26
-
27
-
28
-
29
-
30
-
31
-
32
-
33
-
34
-
35
-
36
-
37
-
38
-
39
-
40
-
41
-
42
-
43
-
44
-
45
-
46
-
47
-
48
-
 49
49 -
 50
50 -
 51
51 -
 52
52 -
 53
53 -
 54
54 -
 55
55 -
 56
56 -
 57
57 -
 58
58 -
 59
59 -
 60
60 -
 61
61 -
 62
62 -
 63
63 -
 64
64 -
 65
65 -
 66
66 -
 67
67 -
 68
68 -
 69
69 -
70
-
71
-
72
-
73
-
74
-
75
-
76
-
77
-
78
-
79
-
80
-
81
-
82
-
83
-
84
-
85
-
86
-
87
-
88
-
89
-
90
-
91
-
92
-
93
-
94
-
95
-
96
-
97
-
98
-
99
-
100
-
101
-
102
-
103
-
104
-
105
-
106
-
107
-
108
-
109
-
110
-
111
-
112
-
113
-
114
-
115
-
116
-
117
-
118
-
119
-
120
-
121
-
122
-
123
-
124
-
125
-
126
-
127
-
128
-
129
-
130
-
131
-
132
-
133
-
134
-
135
-
136
-
137
-
138
-
139
-
140
-
141
-
142
-
143
-
144
-
145
-
146
-
147
-
148
-
149
-
150
-
151
-
152
-
153
-
154
-
155
-
156
-
157
-
158
-
159
-
160
-
161
-
162
 |
 |

financial relief granted to IHOP franchisees. These increases were partially offset by lower bad debt
expense. Applebee’s franchise expenses are relatively smaller than IHOP’s due to advertising expenses.
Franchise fees designated for IHOP’s national advertising fund and local marketing and advertising
cooperatives are recognized as revenue and expense of franchise operation; however, Applebee’s
national advertising fund and local advertising cooperatives constitute agency transactions and therefore
are not recognized as franchise revenue and expense.
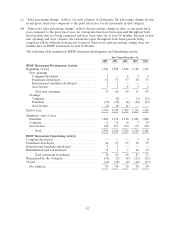
Consolidated franchise operations profit increased by $139.4 million in the 2008 compared to 2007.
This increase was due primarily to the Applebee’s acquisition. IHOP franchise operations profit as a
percentage of revenue increased from 54.1% to 55.1%, or $9.1 million, in 2008 compared to 2007.
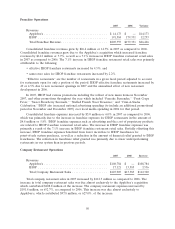
Company Restaurant Operations
2008 2007 Variance
(In thousands)
Company Restaurant Sales
Applebee’s ................................. $1,088,101 $108,784 $ 979,317
IHOP .................................... 15,127 17,121 (1,994)
Total company restaurant sales .................... 1,103,228 125,905 977,323
Cost of company restaurant sales
Applebee’s ................................. 961,019 97,838 (863,181)
IHOP .................................... 17,178 19,610 2,432
Total cost of company restaurant sales ............... 978,197 117,448 (860,749)
Company Restaurant Segment Profit (Loss)
Applebee’s ................................. 127,082 10,946 116,136
IHOP .................................... (2,051) (2,489) 438
Total company restaurant segment profit ............. $ 125,031 $ 8,457 $ 116,574
Total company restaurant sales increased in 2008 by $977.3 million as compared to 2007. The
increase in total company restaurant sales was due to the Applebee’s acquisition which contributed
$979.3 million of the increase. The company restaurant expenses increased by $860.8 million as
compared to 2007. This increase was due to Applebee’s, which contributed $863.2 million of the
increase (see ‘‘Pro Forma Comparison of the fiscal years ended December 31, 2008, 2007 and 2006—
Applebee’s’’).
IHOP company restaurant operations, which are essentially research and development restaurants
and restaurants reacquired from franchisees that are operated on a temporary basis, were relatively
unchanged from the prior year. IHOP company restaurant sales and cost of sales were lower in 2008 as
compared to 2007 due to two fewer effective restaurants, resulting in a slightly lower segment loss.
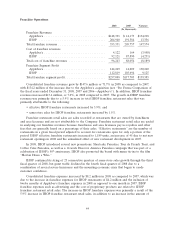
Rental Operations
2008 2007 Variance
(In thousands)
Rental income ................................... $131,347 $132,422 $(1,075)
Rental expenses .................................. 98,057 98,402 345
Rental segment profit .............................. $ 33,290 $ 34,020 $ (730)
Rental operations profit, which is rental income less rental expenses, decreased by $0.7 million or
2.1% in 2008 as compared to 2007. Rental operations profit was impacted by the write-off of deferred
45