IHOP 2008 Annual Report Download - page 71
Download and view the complete annual report
Please find page 71 of the 2008 IHOP annual report below. You can navigate through the pages in the report by either clicking on the pages listed below, or by using the keyword search tool below to find specific information within the annual report.-
 1
1 -
2
-
3
-
4
-
5
-
6
-
7
-
8
-
9
-
10
-
11
-
12
-
13
-
14
-
15
-
16
-
17
-
18
-
19
-
20
-
21
-
22
-
23
-
24
-
25
-
26
-
27
-
28
-
29
-
30
-
31
-
32
-
33
-
34
-
35
-
36
-
37
-
38
-
39
-
40
-
41
-
42
-
43
-
44
-
45
-
46
-
47
-
48
-
49
-
50
-
51
-
52
-
53
-
54
-
55
-
56
-
57
-
58
-
59
-
60
-
 61
61 -
 62
62 -
 63
63 -
 64
64 -
 65
65 -
 66
66 -
 67
67 -
 68
68 -
 69
69 -
 70
70 -
 71
71 -
 72
72 -
 73
73 -
 74
74 -
 75
75 -
 76
76 -
 77
77 -
 78
78 -
 79
79 -
 80
80 -
 81
81 -
82
-
83
-
84
-
85
-
86
-
87
-
88
-
89
-
90
-
91
-
92
-
93
-
94
-
95
-
96
-
97
-
98
-
99
-
100
-
101
-
102
-
103
-
104
-
105
-
106
-
107
-
108
-
109
-
110
-
111
-
112
-
113
-
114
-
115
-
116
-
117
-
118
-
119
-
120
-
121
-
122
-
123
-
124
-
125
-
126
-
127
-
128
-
129
-
130
-
131
-
132
-
133
-
134
-
135
-
136
-
137
-
138
-
139
-
140
-
141
-
142
-
143
-
144
-
145
-
146
-
147
-
148
-
149
-
150
-
151
-
152
-
153
-
154
-
155
-
156
-
157
-
158
-
159
-
160
-
161
-
162
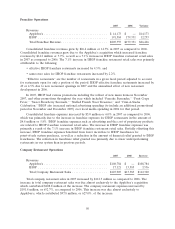
 |
 |

Pro forma company restaurant operation profit for Applebee’s company restaurants decreased by
$27.8 million from $147.2 million in 2006 to $119.4 million in 2007. The components of company
restaurant expenses, as a percentage of company restaurant sales, were as follows:
2007 2006 Variance
(Predecessor
(Pro forma) Applebee’s)
Food and beverage .............................. 26.9% 26.7% 0.2%
Labor ....................................... 34.9 33.6 1.3
Direct and occupancy ............................ 27.8 26.8 1.0
Pre-opening expense ............................. 0.2 0.4 (0.2)
Total Cost of Company Restaurant Sales(a) ............ 89.7% 87.4% 2.3%
(a) Percentages may not add due to rounding.
Total food and beverage costs increased by 0.2% in 2007 as compared to 2006. This increase was
due primarily to the unfavorable impact of a shift in menu mix and higher food costs related to
Applebee’s menu promotions which was partially offset by menu price increases of approximately 2.7%
Total labor costs increased by 1.3% in 2007 as compared to 2006. The increase in 2007 was due
primarily to higher restaurant management salaries and hourly wage rates including the impact of state
minimum wage rate increases as well as higher management incentive compensation.
Direct and occupancy costs increased by 1.0% in 2007 as compared to 2006 due primarily to lower
sales volumes at company restaurants which resulted in unfavorable year-over-year comparisons for
depreciation and rent, as a percentage of sales, due to their relatively fixed nature as well as higher
repairs and maintenance and credit card usage expense. This increase was partially offset by lower
kitchen and dining supplies expense.
Pre-opening expense decreased by 0.2% in 2007 as compared to 2006 due to the number of
company restaurant openings.
General and Administrative Expenses
General and administrative expenses as a percentage of sales increased from 10.7% in 2006 to
15.3% in 2007. The increase was due primarily to additional stock-based compensation recognized and
severance costs accrued for employees who are expected to be terminated in connection with the
Applebee’s acquisition as well as the costs related to the exploration of strategic alternatives for
enhancing shareholder value.
Liquidity and Capital Resources of the Company
Prior to the acquisition of Applebee’s, our primary ongoing sources of liquidity were cash provided
by operating activities and principal receipts from notes and equipment contracts receivable from our
franchisees, while our principal uses of cash were common stock repurchases, payments of dividends
and capital investment.
The acquisition of Applebee’s had a significant impact on the liquidity and capital resources of the
Company. We incurred approximately $2.3 billion of indebtedness. While the addition of Applebee’s
increased our cash flow from operations, a significant portion of the increase was consumed by interest
payments on that indebtedness. Cash paid for interest increased to $194.8 million in 2008 as compared
to $31.3 million in 2007 and $29.8 million in 2006. The amount of indebtedness also limits our ability to
obtain additional financing, due to both explicit limitations in the Indenture under which the
indebtedness was issued and marketplace perception of our remaining debt capacity.
57