IHOP 2008 Annual Report Download - page 67
Download and view the complete annual report
Please find page 67 of the 2008 IHOP annual report below. You can navigate through the pages in the report by either clicking on the pages listed below, or by using the keyword search tool below to find specific information within the annual report.-
 1
1 -
2
-
3
-
4
-
5
-
6
-
7
-
8
-
9
-
10
-
11
-
12
-
13
-
14
-
15
-
16
-
17
-
18
-
19
-
20
-
21
-
22
-
23
-
24
-
25
-
26
-
27
-
28
-
29
-
30
-
31
-
32
-
33
-
34
-
35
-
36
-
37
-
38
-
39
-
40
-
41
-
42
-
43
-
44
-
45
-
46
-
47
-
48
-
49
-
50
-
51
-
52
-
53
-
54
-
55
-
56
-
 57
57 -
 58
58 -
 59
59 -
 60
60 -
 61
61 -
 62
62 -
 63
63 -
 64
64 -
 65
65 -
 66
66 -
 67
67 -
 68
68 -
 69
69 -
 70
70 -
 71
71 -
 72
72 -
 73
73 -
 74
74 -
 75
75 -
 76
76 -
 77
77 -
78
-
79
-
80
-
81
-
82
-
83
-
84
-
85
-
86
-
87
-
88
-
89
-
90
-
91
-
92
-
93
-
94
-
95
-
96
-
97
-
98
-
99
-
100
-
101
-
102
-
103
-
104
-
105
-
106
-
107
-
108
-
109
-
110
-
111
-
112
-
113
-
114
-
115
-
116
-
117
-
118
-
119
-
120
-
121
-
122
-
123
-
124
-
125
-
126
-
127
-
128
-
129
-
130
-
131
-
132
-
133
-
134
-
135
-
136
-
137
-
138
-
139
-
140
-
141
-
142
-
143
-
144
-
145
-
146
-
147
-
148
-
149
-
150
-
151
-
152
-
153
-
154
-
155
-
156
-
157
-
158
-
159
-
160
-
161
-
162
 |
 |

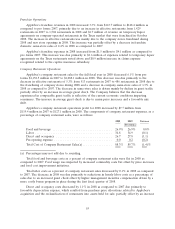
Restaurant Data
The following table sets forth, for each of the past three years, the number of effective restaurants
in the Applebee’s system and information regarding the percentage change in sales at those restaurants
compared to the same period in the prior year.
Year Ended December 31,
2008 2007 2006
(Pro Forma) (Predecessor
Applebee’s)
Applebee’s Restaurant Data
Effective restaurants(a)
Franchise ........................................... 1,504 1,429 1,353
Company ........................................... 486 513 506
Total ............................................ 1,990 1,942 1,859
System-wide(b)
Applebee’s domestic sales percentage change(c)(e) ............. (0.4)% (0.2)% 8.4%
Applebee’s domestic same-store sales percentage change(d)(e) .... (2.2)% (2.1)% (0.6)%
Franchise(b)
Applebee’s domestic sales percentage change (c)(e) ............ 1.6% 0.1% 7.6%
Applebee’s domestic same-store sales percentage change(d)(e) .... (2.4)% (2.0)% (0.5)%
Company
Applebee’s sales percentage change(c)(e) .................... (6.1)% (0.9)% 10.6%
Applebee’s same-store sales percentage (d)(e) ................ (1.3)% (2.2)% (1.0)%
(a) ‘‘Effective restaurants’’ are the number of restaurants in a given fiscal period adjusted to account
for restaurants open for only a portion of the period. Information is presented for all effective
restaurants in the Applebee’s system, which includes restaurants owned by Applebee’s as well as
those owned by franchisees and international licensees.
(b) ‘‘System-wide sales’’ are retail sales of Applebee’s restaurants operated by franchisees and
Applebee’s as reported to the Company. The Company acquired Applebee’s International, Inc. on
November 29, 2007. Applebee’s system-wide sales information includes the full year. Domestic
franchise restaurant sales for Applebee’s restaurants were $3.4 billion, $3.3 billion and $3.3 billion
in the fiscal years ended December 31, 2008, 2007, and 2006, respectively. Domestic franchise sales
for Applebee’s restaurants in the 2007 period subsequent to the acquisition date were
$319.5 million. Franchise restaurant retail sales are sales recorded at restaurants that are owned by
franchisees and are not attributable to the Company. Franchise restaurant retail sales are useful in
analyzing our franchise revenues because franchisees pay us royalties and other fees that are
generally based on a percentage of their sales. Sales of restaurants that are owned by franchisees
are not attributable to the Company.
(c) ‘‘Sales percentage change’’ reflects, for each category of restaurants, the percentage change in sales
in any given fiscal year compared to the prior fiscal year for all restaurants in that category. The
sales percentage change for Applebee’s restaurants was impacted by a 53rd week in 2006. In
addition, all periods for company-owned Applebee’s restaurants exclude the impact of discontinued
operations.
(d) ‘‘Same-store sales percentage change’’ reflects the percentage change in sales, in any given fiscal
year compared to the prior fiscal year, for restaurants that have been operated throughout both
fiscal periods that are being compared and have been open for at least 18 months. Because of new
unit openings and store closures, the restaurants open throughout both fiscal periods being
compared will be different from period to period.
53