IHOP 2008 Annual Report Download - page 141
Download and view the complete annual report
Please find page 141 of the 2008 IHOP annual report below. You can navigate through the pages in the report by either clicking on the pages listed below, or by using the keyword search tool below to find specific information within the annual report.-
 1
1 -
2
-
3
-
4
-
5
-
6
-
7
-
8
-
9
-
10
-
11
-
12
-
13
-
14
-
15
-
16
-
17
-
18
-
19
-
20
-
21
-
22
-
23
-
24
-
25
-
26
-
27
-
28
-
29
-
30
-
31
-
32
-
33
-
34
-
35
-
36
-
37
-
38
-
39
-
40
-
41
-
42
-
43
-
44
-
45
-
46
-
47
-
48
-
49
-
50
-
51
-
52
-
53
-
54
-
55
-
56
-
57
-
58
-
59
-
60
-
61
-
62
-
63
-
64
-
65
-
66
-
67
-
68
-
69
-
70
-
71
-
72
-
73
-
74
-
75
-
76
-
77
-
78
-
79
-
80
-
81
-
82
-
83
-
84
-
85
-
86
-
87
-
88
-
89
-
90
-
91
-
92
-
93
-
94
-
95
-
96
-
97
-
98
-
99
-
100
-
101
-
102
-
103
-
104
-
105
-
106
-
107
-
108
-
109
-
110
-
111
-
112
-
113
-
114
-
115
-
116
-
117
-
118
-
119
-
120
-
121
-
122
-
123
-
124
-
125
-
126
-
127
-
128
-
129
-
130
-
 131
131 -
 132
132 -
 133
133 -
 134
134 -
 135
135 -
 136
136 -
 137
137 -
 138
138 -
 139
139 -
 140
140 -
 141
141 -
 142
142 -
 143
143 -
 144
144 -
 145
145 -
 146
146 -
 147
147 -
 148
148 -
 149
149 -
 150
150 -
 151
151 -
152
-
153
-
154
-
155
-
156
-
157
-
158
-
159
-
160
-
161
-
162
 |
 |

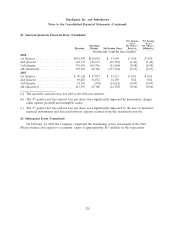
DineEquity, Inc. and Subsidiaries
Notes to the Consolidated Financial Statements (Continued)
22. Segment Reporting
Prior period segment information has been restated to conform to the current year presentation.
Information on segments and a reconciliation to income before income taxes are as follows:
2008 2007 2006
(in thousands)
Applebee’s IHOP Total Applebee’s(1) IHOP Total
Revenues
Franchise operations ................ $ 148,391 $ 204,940 $ 353,331 $ 14,173 $ 191,584 $ 205,757 $179,331
Company restaurants ................ 1,088,101 15,127 1,103,228 108,784 17,121 125,905 13,585
Rental operations .................. 58 131,289 131,347 — 132,422 132,422 132,101
Financing operations ................ — 25,722 25,722 — 20,475 20,475 24,543
Total ......................... $1,236,550 $ 377,078 $1,613,628 $ 122,957 $ 361,602 $ 484,559 $349,560
Intercompany Real Estate Charges
Company restaurants ................ $ — $ — $ — $ — $ 141 $ 141 $ 388
Rental operations .................. — — — — 3,424 3,424 20,535
Corporate ....................... — — — — (3,565) (3,565) (20,923)
Total ......................... $ — $ — $ — $ — $ — $ — $ —
Income (loss) before income taxes
Franchise operations ................ $ 144,269 $ 112,819 $ 257,088 $ 14,009 $ 103,694 $ 117,703 $ 96,252
Company restaurants ................ 127,082 (2,051) 125,031 10,947 (2,489) 8,458 (2,016)
Rental operations .................. 30 33,262 33,292 — 34,020 34,020 34,197
Financing operations ................ — 18,408 18,408 — 19,260 19,260 20,303
Corporate ....................... (503,401) (118,575) (621,976) (27,949) (154,200) (182,149) (75,886)
Income (loss) before income taxes ....... $(232,020) $ 43,863 $ (188,157) $ (2,993) $ 285 $ (2,708) $ 72,850
Income tax (benefit) expense ........... $ (51,492) $ 17,794 $ (33,698) $ (1,738) $ (490) $ (2,228) $ 28,297
Interest Expense
Company restaurants ................ $ 507 $ 412 $ 919 $ 51 $ 496 $ 547 $ 514
Rental operations .................. — 20,258 20,258 — 20,815 20,815 21,361
Financing operations ................ — 16 16 — — — 68
Corporate ....................... 168,325 34,816 203,141 14,635 14,019 28,654 7,902
Total ......................... $ 168,832 $ 55,502 $ 224,334 $ 14,686 $ 35,330 $ 50,016 $ 29,845
Depreciation and amortization
Franchise operations ................ $ 10,027 $ — $ 10,027 $ 981 $ — $ 981 $ —
Company restaurants ................ 37,527 716 38,243 4,856 882 5,738 379
Rental operations .................. 28 11,872 11,900 — 12,029 12,029 6,268
Financing operations ................ — — — — — — —
Corporate ....................... 6,466 6,438 12,904 775 6,531 7,307 13,403
Total ......................... $ 54,048 $ 19,026 $ 73,074 $ 6,612 $ 19,442 $ 26,055 $ 20,050
Impairment and closure charges ......... $ 238,958 $ 1,672 $ 240,630 $ 19 $ 4,307 $ 4,381 $ 43
Capital Expenditures
Franchise operations ................ $ — $ 163 $ 163 $ — $ 430 $ 430 $ 233
Company restaurants ................ 12,708 1,622 14,330 5,872 439 6,311 7,076
Corporate ....................... 12,668 4,604 17,272 3,726 1,961 5,687 2,117
Total ......................... $ 25,376 $ 6,389 $ 31,765 $ 9,598 $ 2,830 $ 12,428 $ 9,426
Goodwill ........................ $ 686,703 $ 10,767 $ 697,470 $ 719,961 $ 10,767 $ 730,728 $ 10,767
Total Assets
Franchise operations ................ $1,480,733 $ 38,673 $1,519,406 $1,365,119 $ 50,678 $1,415,797 $ 32,988
Company restaurants ................ 724,533 10,284 734,817 1,229,101 5,610 1,234,711 8,701
Rental operations .................. 5,701 453,285 458,986 — 465,435 465,435 255,545
Financing operations ................ — 198,909 198,909 — 192,260 192,260 198,651
Corporate ....................... 374,129 74,970 449,099 459,677 63,282 522,959 270,365
Total ......................... $2,585,096 $ 776,121 $3,361,217 $3,053,897 $ 777,265 $3,831,162 $766,250
(1) From acquisition date.
127