IHOP 2008 Annual Report Download - page 140
Download and view the complete annual report
Please find page 140 of the 2008 IHOP annual report below. You can navigate through the pages in the report by either clicking on the pages listed below, or by using the keyword search tool below to find specific information within the annual report.-
 1
1 -
2
-
3
-
4
-
5
-
6
-
7
-
8
-
9
-
10
-
11
-
12
-
13
-
14
-
15
-
16
-
17
-
18
-
19
-
20
-
21
-
22
-
23
-
24
-
25
-
26
-
27
-
28
-
29
-
30
-
31
-
32
-
33
-
34
-
35
-
36
-
37
-
38
-
39
-
40
-
41
-
42
-
43
-
44
-
45
-
46
-
47
-
48
-
49
-
50
-
51
-
52
-
53
-
54
-
55
-
56
-
57
-
58
-
59
-
60
-
61
-
62
-
63
-
64
-
65
-
66
-
67
-
68
-
69
-
70
-
71
-
72
-
73
-
74
-
75
-
76
-
77
-
78
-
79
-
80
-
81
-
82
-
83
-
84
-
85
-
86
-
87
-
88
-
89
-
90
-
91
-
92
-
93
-
94
-
95
-
96
-
97
-
98
-
99
-
100
-
101
-
102
-
103
-
104
-
105
-
106
-
107
-
108
-
109
-
110
-
111
-
112
-
113
-
114
-
115
-
116
-
117
-
118
-
119
-
120
-
121
-
122
-
123
-
124
-
125
-
126
-
127
-
128
-
129
-
 130
130 -
 131
131 -
 132
132 -
 133
133 -
 134
134 -
 135
135 -
 136
136 -
 137
137 -
 138
138 -
 139
139 -
 140
140 -
 141
141 -
 142
142 -
 143
143 -
 144
144 -
 145
145 -
 146
146 -
 147
147 -
 148
148 -
 149
149 -
 150
150 -
151
-
152
-
153
-
154
-
155
-
156
-
157
-
158
-
159
-
160
-
161
-
162
 |
 |

DineEquity, Inc. and Subsidiaries
Notes to the Consolidated Financial Statements (Continued)
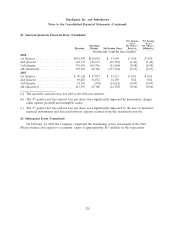
21. Net (Loss) Income Per Share
The computation of the Company’s basic and diluted net (loss) income per share is as follows:
Year Ended December 31,
2008 2007 2006
(In thousands, except per share
data)
Numerator for basic and dilutive income (loss) per common share:
Net (loss) income ....................................... $(154,459) $ (480) $44,553
Less: Series A preferred stock dividends ..................... (19,000) (1,561) —
Less: Accretion of Series B preferred stock ................... (2,151) (181) —
Less: Share of net loss allocated to unvested participating restricted
stock ............................................. 6,417 — —
(Loss) income available to common stockholders ................ $(169,193) $(2,222) $44,553
Denominator:
Weighted average outstanding shares of common stock ............ 16,764 17,232 18,085
Dilutive effect of:
Common stock equivalents ............................... — — 213
Common stock and common stock equivalents .................. 16,764 17,232 18,298
Net (loss) income per common share:
Basic ............................................... $ (10.09) $ (0.13) $ 2.46
Diluted ............................................. $ (10.09) $ (0.13) $ 2.43
For the years ended December 31, 2008 and 2007, diluted loss per common share is computed
using the weighted average number of common shares outstanding during the period, as the 756,000
and 627,000 shares, respectively, from common stock equivalents would have been antidilutive.
126