IHOP 2008 Annual Report Download - page 57
Download and view the complete annual report
Please find page 57 of the 2008 IHOP annual report below. You can navigate through the pages in the report by either clicking on the pages listed below, or by using the keyword search tool below to find specific information within the annual report.-
 1
1 -
2
-
3
-
4
-
5
-
6
-
7
-
8
-
9
-
10
-
11
-
12
-
13
-
14
-
15
-
16
-
17
-
18
-
19
-
20
-
21
-
22
-
23
-
24
-
25
-
26
-
27
-
28
-
29
-
30
-
31
-
32
-
33
-
34
-
35
-
36
-
37
-
38
-
39
-
40
-
41
-
42
-
43
-
44
-
45
-
46
-
 47
47 -
 48
48 -
 49
49 -
 50
50 -
 51
51 -
 52
52 -
 53
53 -
 54
54 -
 55
55 -
 56
56 -
 57
57 -
 58
58 -
 59
59 -
 60
60 -
 61
61 -
 62
62 -
 63
63 -
 64
64 -
 65
65 -
 66
66 -
 67
67 -
68
-
69
-
70
-
71
-
72
-
73
-
74
-
75
-
76
-
77
-
78
-
79
-
80
-
81
-
82
-
83
-
84
-
85
-
86
-
87
-
88
-
89
-
90
-
91
-
92
-
93
-
94
-
95
-
96
-
97
-
98
-
99
-
100
-
101
-
102
-
103
-
104
-
105
-
106
-
107
-
108
-
109
-
110
-
111
-
112
-
113
-
114
-
115
-
116
-
117
-
118
-
119
-
120
-
121
-
122
-
123
-
124
-
125
-
126
-
127
-
128
-
129
-
130
-
131
-
132
-
133
-
134
-
135
-
136
-
137
-
138
-
139
-
140
-
141
-
142
-
143
-
144
-
145
-
146
-
147
-
148
-
149
-
150
-
151
-
152
-
153
-
154
-
155
-
156
-
157
-
158
-
159
-
160
-
161
-
162
 |
 |

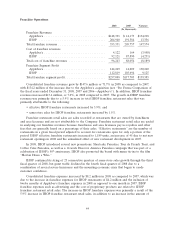
Results of Operations
The following table contains information derived from our consolidated statements of operations
expressed as a percentage of total operating revenues, except where otherwise noted. Percentages may
not add due to rounding.
Year Ended December 31,
2008 2007 2006
Revenues
Franchise operations revenues ............................ 21.9% 42.4% 51.3%
Company restaurant sales ................................ 68.4 26.0 3.9
Rental operations income ................................ 8.1 27.4 37.8
Financing operations revenues ............................ 1.6 4.2 7.0
Total revenues .................................... 100.0% 100.0% 100.0%
Costs and Expenses
Franchise operation expenses ............................. 6.0% 18.2% 23.8%
Company restaurant expenses ............................. 60.6 24.2 4.5
Rental operations expenses .............................. 6.1 20.3 28.0
Financing operations expenses ............................ 0.5 0.3 1.2
General and administrative expenses ........................ 11.3 16.8 18.2
Interest expense ...................................... 12.6 5.9 2.3
Amortization of intangible assets .......................... 0.8 0.2 0.0
Other (income) expense, net ............................. (0.1) 0.4 1.3
Impairment and closure charges ........................... 14.9 0.9 0.0
Loss on derivative financial instrument ...................... — 12.8 —
(Gain) loss on extinguishment of debt ....................... (0.9) 0.5 —
Total costs and expenses ............................... 111.7 100.6 79.2
(Loss) income before income taxes .......................... (11.7) (0.6) 20.8
(Benefit) provision for income taxes .......................... (2.1) (0.5) 8.1
Net (loss) income ....................................... (9.6)% (0.1)% 12.7%
Comparison of the fiscal years ended December 31, 2008 and 2007
Overview
Our 2008 financial results were significantly impacted by (i) the inclusion of twelve months of
Applebee’s operations as compared with one month in fiscal 2007, (ii) impairment charges related to
goodwill, intangible assets and real property, (iii) increased interest expense on $2.3 billion worth of
funded debt and (iv) a loss on a derivative financial instrument in 2007 that did not recur in 2008. In
comparing the Company’s financial results for 2008 to those in 2007, we note that:
• total revenues increased $1.1 billion from $0.5 billion in 2007 to $1.6 billion in 2008, with
revenues from Applebee’s company restaurant sales comprising more than two-thirds of total
revenue;
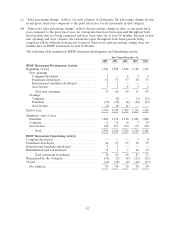
• operations profit from the four operating segments combined increased by $254 million from
$179 million in 2007 to $433 million in 2008; and
• general and administrative expenses decreased as a percentage of total revenues from 16.8% in
2007 to 11.3% in 2008.
43