IHOP 2008 Annual Report Download - page 58
Download and view the complete annual report
Please find page 58 of the 2008 IHOP annual report below. You can navigate through the pages in the report by either clicking on the pages listed below, or by using the keyword search tool below to find specific information within the annual report.-
 1
1 -
2
-
3
-
4
-
5
-
6
-
7
-
8
-
9
-
10
-
11
-
12
-
13
-
14
-
15
-
16
-
17
-
18
-
19
-
20
-
21
-
22
-
23
-
24
-
25
-
26
-
27
-
28
-
29
-
30
-
31
-
32
-
33
-
34
-
35
-
36
-
37
-
38
-
39
-
40
-
41
-
42
-
43
-
44
-
45
-
46
-
47
-
 48
48 -
 49
49 -
 50
50 -
 51
51 -
 52
52 -
 53
53 -
 54
54 -
 55
55 -
 56
56 -
 57
57 -
 58
58 -
 59
59 -
 60
60 -
 61
61 -
 62
62 -
 63
63 -
 64
64 -
 65
65 -
 66
66 -
 67
67 -
 68
68 -
69
-
70
-
71
-
72
-
73
-
74
-
75
-
76
-
77
-
78
-
79
-
80
-
81
-
82
-
83
-
84
-
85
-
86
-
87
-
88
-
89
-
90
-
91
-
92
-
93
-
94
-
95
-
96
-
97
-
98
-
99
-
100
-
101
-
102
-
103
-
104
-
105
-
106
-
107
-
108
-
109
-
110
-
111
-
112
-
113
-
114
-
115
-
116
-
117
-
118
-
119
-
120
-
121
-
122
-
123
-
124
-
125
-
126
-
127
-
128
-
129
-
130
-
131
-
132
-
133
-
134
-
135
-
136
-
137
-
138
-
139
-
140
-
141
-
142
-
143
-
144
-
145
-
146
-
147
-
148
-
149
-
150
-
151
-
152
-
153
-
154
-
155
-
156
-
157
-
158
-
159
-
160
-
161
-
162
 |
 |

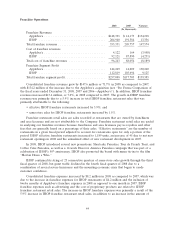
Franchise Operations
2008 2007 Variance
(In thousands)
Franchise Revenues
Applebee’s ................................... $148,391 $ 14,173 $134,218
IHOP ...................................... 204,940 191,584 13,356
Total franchise revenues ........................... 353,331 205,757 147,574
Cost of franchise revenues
Applebee’s ................................... 4,122 164 (3,958)
IHOP ...................................... 92,121 87,890 (4,231)
Total cost of franchise revenues ..................... 96,243 88,054 (8,189)
Franchise Segment Profit
Applebee’s ................................... 144,269 14,009 130,260
IHOP ...................................... 112,819 103,694 9,125
Total franchise segment profit ....................... $257,088 $117,703 $139,385
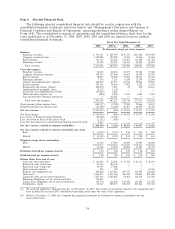
Consolidated franchise revenues grew by $147.6 million or 71.7% in 2008 as compared to 2007,
with $134.2 million of the increase due to the Applebee’s acquisition (see ‘‘Pro Forma Comparison of
the fiscal years ended December 31, 2008, 2007 and 2006—Applebee’s’’). In addition, IHOP franchise
revenues increased $13.4 million, or 7.0%, in 2008 compared to 2007. The growth in IHOP franchise
revenues was primarily due to a 5.9% increase in total IHOP franchise restaurant sales that was
primarily attributable to the following:
• effective IHOP franchise restaurants increased by 3.9%; and
• same-store sales for IHOP franchise restaurants increased by 1.5%.
Franchise restaurant retail sales are sales recorded at restaurants that are owned by franchisees
and area licensees and are not attributable to the Company. Franchise restaurant retail sales are useful
in analyzing our franchise revenues because franchisees and area licensees pay us royalties and other
fees that are generally based on a percentage of their sales. ‘‘Effective restaurants’’ are the number of
restaurants in a given fiscal period adjusted to account for restaurants open for only a portion of the
period. IHOP effective franchise restaurants increased to 1,189 units, an increase of 45 due to net new
restaurant openings in 2008 and the annualized effect of new restaurant development in 2007.
In 2008, IHOP introduced several new promotions: Shortcake Pancakes, Tour de French Toast, and
Coffee Cake Pancakes, as well as a 14-week Discover America Pancakes campaign that was part of a
celebration of IHOP’s 50th anniversary. IHOP also promoted the brand with menu tie-ins to the film
‘‘Horton Hears a Who.’’
IHOP continued its string of 23 consecutive quarters of same-store sales growth through the third
fiscal quarter of 2008, but guest traffic declined in the fourth fiscal quarter of 2008 due to a
combination of several severe hurricanes and the mounting economic crisis that began to erode
customer confidence.
Consolidated franchise expenses increased by $8.2 million in 2008 as compared to 2007, which was
due to the increase in franchise expenses for IHOP restaurants of $4.2 million and the inclusion of
twelve months of Applebee’s franchise expenses in 2008 as opposed to one month in 2007. IHOP
franchise expenses such as advertising and the cost of proprietary products are related to IHOP
franchise restaurant retail sales. The increase in IHOP franchise expenses was primarily a result of the
5.9% increase in IHOP franchise restaurant retail sales, in addition to an increase in the amount of
44