IHOP 2008 Annual Report Download - page 26
Download and view the complete annual report
Please find page 26 of the 2008 IHOP annual report below. You can navigate through the pages in the report by either clicking on the pages listed below, or by using the keyword search tool below to find specific information within the annual report.-
 1
1 -
2
-
3
-
4
-
5
-
6
-
7
-
8
-
9
-
10
-
11
-
12
-
13
-
14
-
15
-
 16
16 -
 17
17 -
 18
18 -
 19
19 -
 20
20 -
 21
21 -
 22
22 -
 23
23 -
 24
24 -
 25
25 -
 26
26 -
 27
27 -
 28
28 -
 29
29 -
 30
30 -
 31
31 -
 32
32 -
 33
33 -
 34
34 -
 35
35 -
 36
36 -
37
-
38
-
39
-
40
-
41
-
42
-
43
-
44
-
45
-
46
-
47
-
48
-
49
-
50
-
51
-
52
-
53
-
54
-
55
-
56
-
57
-
58
-
59
-
60
-
61
-
62
-
63
-
64
-
65
-
66
-
67
-
68
-
69
-
70
-
71
-
72
-
73
-
74
-
75
-
76
-
77
-
78
-
79
-
80
-
81
-
82
-
83
-
84
-
85
-
86
-
87
-
88
-
89
-
90
-
91
-
92
-
93
-
94
-
95
-
96
-
97
-
98
-
99
-
100
-
101
-
102
-
103
-
104
-
105
-
106
-
107
-
108
-
109
-
110
-
111
-
112
-
113
-
114
-
115
-
116
-
117
-
118
-
119
-
120
-
121
-
122
-
123
-
124
-
125
-
126
-
127
-
128
-
129
-
130
-
131
-
132
-
133
-
134
-
135
-
136
-
137
-
138
-
139
-
140
-
141
-
142
-
143
-
144
-
145
-
146
-
147
-
148
-
149
-
150
-
151
-
152
-
153
-
154
-
155
-
156
-
157
-
158
-
159
-
160
-
161
-
162
 |
 |

Company-Operated Restaurants
Company-operated IHOP restaurants are essentially comprised of our IHOP owned restaurants in
Cincinnati, Ohio. In addition, from time to time, restaurants developed by us under the Previous
Business Model are returned by franchisees to us and may be operated by the Company for an
indefinite period until they are refranchised. As of December 31, 2008, there were a total of 11
company-operated restaurants, ten of which were located in the Cincinnati market.
We maintain the company-operated restaurants in Cincinnati to facilitate the testing of new
building types and remodel designs, new products and equipment, new operational procedures, and new
marketing, brand and design elements.
Restaurant Development
The Current Business Model relies on franchisees to obtain their own financing to develop IHOP
restaurants. We review and approve the franchisees’ proposed sites but do not contribute capital or
become the franchisees’ landlord. Under the Current Business Model, substantially all new IHOP
restaurants are financed and developed by franchisees or area licensees. In 2008, our franchisees and
area licensees financed and developed 70 new restaurants and we developed one additional restaurant
in our company operations. As of the date of this report we do not intend to build additional IHOP
restaurants in the Cincinnati market.
New IHOP restaurants are only developed after a stringent site selection process supervised by our
senior management. We expect our franchisees to add restaurants to the IHOP system in major
markets where we already have a core guest base. We believe that concentrating growth in existing
markets allows us to achieve economies of scale in our supervisory and advertising functions. We also
look to have our franchisees strategically add restaurants in new markets in which we currently have no
presence or our presence is limited.
Future Restaurant Development
In 2008, IHOP entered into 24 franchise development agreements. As of December 31, 2008, we
had signed commitments from franchisees to build 307 IHOP restaurants over the next nine years plus
options for an additional 111 restaurants. This number includes 18 restaurants under single-store
development agreements, 337 restaurants under multi-store development agreements and 63 restaurants
under international development agreements.
In 2009, we expect to open a total of 65 to 75 new IHOP restaurants, including 55 to 60 franchise
restaurants, three to five area license restaurants in Florida and seven to ten restaurants outside the
U.S. or in non-traditional channels.
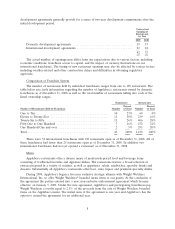
The following table represents our IHOP restaurant development commitments, including options,
as of December 31, 2008:
Contractual Openings of
Restaurants by Year
Number of Signed 2012 and
Agreements at 12/31/08 2009 2010 2011 thereafter Total
Single-store development agreements ....... 18 12 5 1 — 18
Multi-store development agreements ....... 80 74 55 43 165 337
International development agreements ...... 7 8 6 5 44 63
105 94 66 49 209 418
The actual number of openings in any period may differ from the number of signed commitments.
Historically, the actual number of restaurants developed in a particular year has been less than the
12