IHOP 2008 Annual Report Download - page 70
Download and view the complete annual report
Please find page 70 of the 2008 IHOP annual report below. You can navigate through the pages in the report by either clicking on the pages listed below, or by using the keyword search tool below to find specific information within the annual report.-
 1
1 -
2
-
3
-
4
-
5
-
6
-
7
-
8
-
9
-
10
-
11
-
12
-
13
-
14
-
15
-
16
-
17
-
18
-
19
-
20
-
21
-
22
-
23
-
24
-
25
-
26
-
27
-
28
-
29
-
30
-
31
-
32
-
33
-
34
-
35
-
36
-
37
-
38
-
39
-
40
-
41
-
42
-
43
-
44
-
45
-
46
-
47
-
48
-
49
-
50
-
51
-
52
-
53
-
54
-
55
-
56
-
57
-
58
-
59
-
 60
60 -
 61
61 -
 62
62 -
 63
63 -
 64
64 -
 65
65 -
 66
66 -
 67
67 -
 68
68 -
 69
69 -
 70
70 -
 71
71 -
 72
72 -
 73
73 -
 74
74 -
 75
75 -
 76
76 -
 77
77 -
 78
78 -
 79
79 -
 80
80 -
81
-
82
-
83
-
84
-
85
-
86
-
87
-
88
-
89
-
90
-
91
-
92
-
93
-
94
-
95
-
96
-
97
-
98
-
99
-
100
-
101
-
102
-
103
-
104
-
105
-
106
-
107
-
108
-
109
-
110
-
111
-
112
-
113
-
114
-
115
-
116
-
117
-
118
-
119
-
120
-
121
-
122
-
123
-
124
-
125
-
126
-
127
-
128
-
129
-
130
-
131
-
132
-
133
-
134
-
135
-
136
-
137
-
138
-
139
-
140
-
141
-
142
-
143
-
144
-
145
-
146
-
147
-
148
-
149
-
150
-
151
-
152
-
153
-
154
-
155
-
156
-
157
-
158
-
159
-
160
-
161
-
162
 |
 |

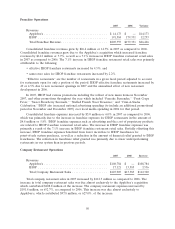
in rent expense and smallwares associated with purchase accounting and unfavorable utility expense.
Pre-opening expense decreased by 0.2% in 2008 as compared to 2007 due to opening one company
restaurant in early 2008 as compared to 14 in 2007. We do not currently plan to open any domestic
company-operated restaurants in the foreseeable future.
Rental Operations
As the result of several transactions related to the franchising of Applebee’s company-operated
restaurants, Applebee’s now has rental income. The amount of Applebee’s rental income in 2008 was
$58,000 offset by $28,000 in expenses. This activity relates only to the franchising of the restaurants;
Applebee’s is not entering into rental operations similar to those of IHOP.
General and Administrative Expenses
General and administrative expenses as a percentage of sales decreased from 15.3% in 2007 to
8.2% in 2008. The decrease was due primarily to the non-recurrence of stock-based compensation and
severance costs incurred in connection with the Applebee’s acquisition as well as non-recurrence of
costs related to the exploration of strategic alternatives for enhancing shareholder value.
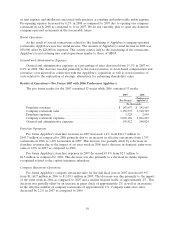
Results of Operations—Pro Forma 2007 with 2006 Predecessor Applebee’s
The pro forma results for the 2007 contained 52 weeks while 2006 contained 53 weeks.
2007 2006
(Predecessor
(Pro Forma) Applebee’s)
(In thousands)
Franchise revenues .................................... $ 143,697 $ 141,663
Company restaurant sales ............................... 1,158,537 1,168,703
Franchise expenses .................................... 1,528 2,699
Company restaurant expenses ............................. 1,039,126 1,021,493
General and administrative expenses ....................... 199,512 140,824
Franchise Operations
Pro forma Applebee’s franchise revenues in 2007 increased 1.4% from $141.7 million to
$143.7 million as compared to 2006 primarily due to an increase in effective restaurants from 1,353
restaurants in 2006 to 1,429 restaurants in 2007. This increase was partially offset by a decrease in
franchise revenues due to the impact of an extra week in 2006 and a decrease in domestic same-store
sales of 2.0% in 2007 as compared to 2006.
Pro forma Applebee’s franchise expenses in 2007 decreased 43.4% from $2.7 million to
$1.5 million as compared to 2006. This decrease was due primarily to a decrease in claims expense
recognized related to the captive insurance subsidiary.
Company Restaurant Operations
Pro forma Applebee’s company restaurant sales for the full fiscal year in 2007 decreased 0.9%
from $1,168.7 million in 2006 to $1,158.5 million in 2007. This decrease was due primarily to the impact
of the extra week in 2006 as compared to 2007 and a decline in guest traffic of approximately 4%. This
decrease was partially offset by an increase in guest check of approximately 2% as well as an increase
in the effective number of company restaurants of approximately 1%. Company same-store sales
decreased by 2.2% in 2007 as compared to 2006.
56